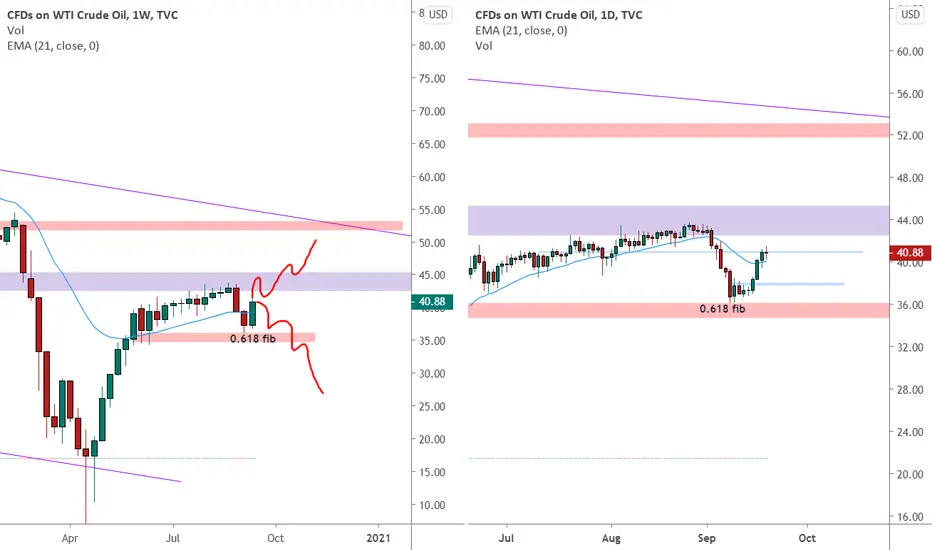
Oil on the Weekly chart hit the strong resistance near to a monthly level and start a retracement back.
The market after hit the lower weekly structure at the 0.618 fib level retracement and couldn’t manage to break below.
Price bounce over it and create a weekly double bottom higher close.
In the lower right chart (daily) we can see that price is now near to a minor daily resistance.
We will consider to open a position only at the break of the key level as shown on the chart.
–––––
Follow the Shrimp 🦐
Here is the Plancton0618 technical analysis , please comment below if you have any question.
The ENTRY in the market will be taken only if the condition of Plancton0618 strategy will trigger
Wyłączenie odpowiedzialności
Informacje i publikacje nie stanowią i nie powinny być traktowane jako porady finansowe, inwestycyjne, tradingowe ani jakiekolwiek inne rekomendacje dostarczane lub zatwierdzone przez TradingView. Więcej informacji znajduje się w Warunkach użytkowania.
Wyłączenie odpowiedzialności
Informacje i publikacje nie stanowią i nie powinny być traktowane jako porady finansowe, inwestycyjne, tradingowe ani jakiekolwiek inne rekomendacje dostarczane lub zatwierdzone przez TradingView. Więcej informacji znajduje się w Warunkach użytkowania.