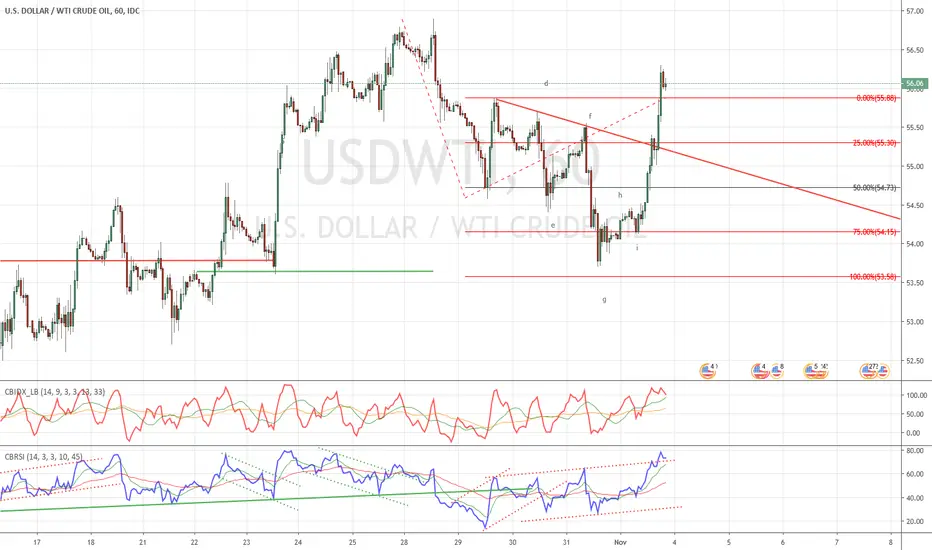
Yesterday the price action of WTI made a promising bullish setup.
First of all the bearish trend on the hourly chart, which started on October 28th, ended a few cents above the projected price range of $53,58.
Since then a strong opposite bullish price reaction has unfolded which broke many resistances.
Furthermore, the RSI broke out of a descending channel (negative reversal) and reached the 80 area, strengthening the bullish outlook of WTI.
Before getting long you should wait for a price pullback. This will give you the opportunity to calculate the price projections.
Wyłączenie odpowiedzialności
Informacje i publikacje przygotowane przez TradingView lub jego użytkowników, prezentowane na tej stronie, nie stanowią rekomendacji ani porad handlowych, inwestycyjnych i finansowych i nie powinny być w ten sposób traktowane ani wykorzystywane. Więcej informacji na ten temat znajdziesz w naszym Regulaminie.