🚀 US2000 Index – Thief Plan: LSMA Pullback + Layered Entries 📊
📌 Trading Plan (Swing / Day Trade)
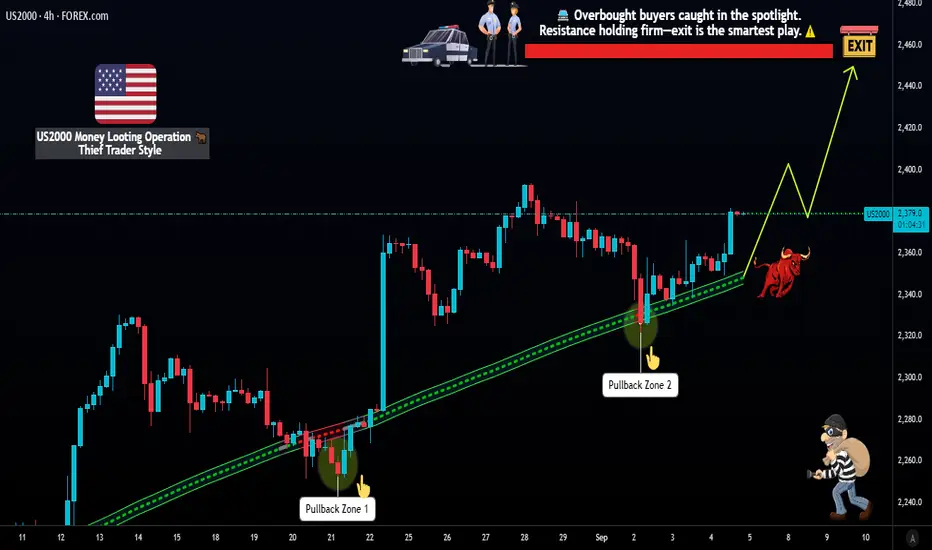
Strategy: Bullish LSMA moving average pullback plan 📈
Thief Style Entries (Layering Method):
Multiple buy-limit layers at 2340 / 2350 / 2360 / 2370
You can increase layers based on your own strategy & risk 🧩
Stop Loss (SL): Thief SL @ 2310 (adjust based on your own plan & risk) 🛡️
Target (TP): Strong resistance at 2450 ⚠️ – “Police barricade” 🚓
Note: This is not a fixed TP recommendation. Thief OG’s 🎭, take profits where it fits your risk and reward. 💰
❓ Why This Plan? (Thief Logic)
🔹 Technical (Thief Strategy)
Bulls loading pressure with LSMA pullback signals 🐂.
Layered entries reduce timing risk and allow multiple profit grabs.
Strong resistance ahead at 2450 = escape zone before “police barricade” 🚨.
🔹 Sentimental Reasoning
Retail sentiment 58% bullish 🟢 vs. 32% bearish 🔴 → optimism is leaning upward.
Institutions also show 52% bullish bias, confirming retail direction ⚖️.
Fear & Greed index at 52/100 = Neutral 😐 → balanced emotions, not overheated.
🔹 Fundamental Reasoning
Earnings growth ~12% expected in 2025 💼 supporting equity demand.
Consumer spending still rising (+0.5% in July) 🛍️ keeps the economy resilient.
Fed policy steady at 4.25%–4.50% 🏦 = stable environment for stocks.
🔹 Macro Reasoning
Inflation above Fed target (Core PCE 2.9% y/y) 📈 = caution flag.
Trade tariffs 🌐 add uncertainty, but no crash-level risk.
Fed rate cut expected in September 🔽 = bullish fuel if confirmed.
👉 Thief Conclusion: Fundamentals 💼 + Sentiment 🧠 + Macro 🌍 align with a slightly bullish thief setup. The layering style plan matches the market bias → stack the layers, steal the profits, and escape before 2450 barricade hits 🚀💰.
*********************************************************************************************************************
📊 US2000 Index CFD Data Report – September 5, 2025
🕒 Real-Time Snapshot
Daily Change: +0.89% (+19.12 pts) 🚀
Monthly Trend: +3.28% 📅
Yearly Trend: +18.21% 🌟
😊 Investor Sentiment Outlook
Retail Traders:
Bullish: 58% 🐂
Bearish: 32% 🐻
Neutral: 10% ⚖️
Institutional Traders:
Bullish: 52% 🐂
Bearish: 38% 🐻
Neutral: 10% ⚖️
🌡️ Fear & Greed Index
Current: 52/100 (Neutral) 😐
Fear: Below 45
Greed: Above 55
Market mood balanced ⚖️
📈 Fundamental Score: 72/100
Corporate earnings growth ~12% (2025 outlook) 💼
Consumer spending resilient (+0.5% in July) 🛍️
Fed funds steady at 4.25%–4.50% 🏦
🌍 Macro Score: 65/100
Inflation still above target (Core PCE 2.9% y/y) 📈
Tariff policies = trade uncertainty 🌐
Fed rate cut expected September 🔽
🐂🐻 Overall Market Outlook: Slightly Bullish
Score: 68/100 🐂
Reason: Strong earnings + consumer demand support upside, but tariffs + inflation cap growth. Expect consolidation with bullish tilt 🚀
🔑 Key Takeaways
Neutral → bullish tilt 😐➡️🐂
Retail + institutional both lean optimistic ⚖️
Fundamentals strong 💼, macro mixed 🌍
Payroll data = key Fed signal today 📊
Thief Plan aligns with market bias & LSMA pullback 📈
👀 Related Pairs to Watch
 US30
US30
 SPX500
 NAS100
 DXY
DXY
 VIX
VIX
✨ “If you find value in my analysis, a 👍 and 🚀 boost is much appreciated — it helps me share more setups with the community!”
#US2000 #Russell2000 #IndexTrading #ThiefPlan #SwingTrade #DayTrading #StockIndices #MarketOutlook #FearAndGreed #TradingStrategy
📌 Trading Plan (Swing / Day Trade)
Strategy: Bullish LSMA moving average pullback plan 📈
Thief Style Entries (Layering Method):
Multiple buy-limit layers at 2340 / 2350 / 2360 / 2370
You can increase layers based on your own strategy & risk 🧩
Stop Loss (SL): Thief SL @ 2310 (adjust based on your own plan & risk) 🛡️
Target (TP): Strong resistance at 2450 ⚠️ – “Police barricade” 🚓
Note: This is not a fixed TP recommendation. Thief OG’s 🎭, take profits where it fits your risk and reward. 💰
❓ Why This Plan? (Thief Logic)
🔹 Technical (Thief Strategy)
Bulls loading pressure with LSMA pullback signals 🐂.
Layered entries reduce timing risk and allow multiple profit grabs.
Strong resistance ahead at 2450 = escape zone before “police barricade” 🚨.
🔹 Sentimental Reasoning
Retail sentiment 58% bullish 🟢 vs. 32% bearish 🔴 → optimism is leaning upward.
Institutions also show 52% bullish bias, confirming retail direction ⚖️.
Fear & Greed index at 52/100 = Neutral 😐 → balanced emotions, not overheated.
🔹 Fundamental Reasoning
Earnings growth ~12% expected in 2025 💼 supporting equity demand.
Consumer spending still rising (+0.5% in July) 🛍️ keeps the economy resilient.
Fed policy steady at 4.25%–4.50% 🏦 = stable environment for stocks.
🔹 Macro Reasoning
Inflation above Fed target (Core PCE 2.9% y/y) 📈 = caution flag.
Trade tariffs 🌐 add uncertainty, but no crash-level risk.
Fed rate cut expected in September 🔽 = bullish fuel if confirmed.
👉 Thief Conclusion: Fundamentals 💼 + Sentiment 🧠 + Macro 🌍 align with a slightly bullish thief setup. The layering style plan matches the market bias → stack the layers, steal the profits, and escape before 2450 barricade hits 🚀💰.
*********************************************************************************************************************
📊 US2000 Index CFD Data Report – September 5, 2025
🕒 Real-Time Snapshot
Daily Change: +0.89% (+19.12 pts) 🚀
Monthly Trend: +3.28% 📅
Yearly Trend: +18.21% 🌟
😊 Investor Sentiment Outlook
Retail Traders:
Bullish: 58% 🐂
Bearish: 32% 🐻
Neutral: 10% ⚖️
Institutional Traders:
Bullish: 52% 🐂
Bearish: 38% 🐻
Neutral: 10% ⚖️
🌡️ Fear & Greed Index
Current: 52/100 (Neutral) 😐
Fear: Below 45
Greed: Above 55
Market mood balanced ⚖️
📈 Fundamental Score: 72/100
Corporate earnings growth ~12% (2025 outlook) 💼
Consumer spending resilient (+0.5% in July) 🛍️
Fed funds steady at 4.25%–4.50% 🏦
🌍 Macro Score: 65/100
Inflation still above target (Core PCE 2.9% y/y) 📈
Tariff policies = trade uncertainty 🌐
Fed rate cut expected September 🔽
🐂🐻 Overall Market Outlook: Slightly Bullish
Score: 68/100 🐂
Reason: Strong earnings + consumer demand support upside, but tariffs + inflation cap growth. Expect consolidation with bullish tilt 🚀
🔑 Key Takeaways
Neutral → bullish tilt 😐➡️🐂
Retail + institutional both lean optimistic ⚖️
Fundamentals strong 💼, macro mixed 🌍
Payroll data = key Fed signal today 📊
Thief Plan aligns with market bias & LSMA pullback 📈
👀 Related Pairs to Watch
✨ “If you find value in my analysis, a 👍 and 🚀 boost is much appreciated — it helps me share more setups with the community!”
#US2000 #Russell2000 #IndexTrading #ThiefPlan #SwingTrade #DayTrading #StockIndices #MarketOutlook #FearAndGreed #TradingStrategy
Zlecenie aktywne
Transakcja zamknięta: osiągnięto wyznaczony cel
📈 US2000 INDEX CFD Live Feed ReportAs of October 6, 2025 (Markets closed; latest close October 3, 2025. US markets halted due to government shutdown – data reflects pre-shutdown feed. As a trader note: CFDs mirror the spot Russell 2000 index (^RUT),
🔍 Step 1: Current Price Snapshot
Live Price: 2,476.18 USD
Explanation: This is the closing value of the Russell 2000 index, tracking ~2,000 small-cap US stocks. Up 17.69 points (+0.72%) from prior session – shows mild daily gain amid broader equity recovery, but shutdown delays real-time updates. For CFD trading, this sets your entry baseline; volatility may spike on reopen.
📊 Step 2: Fundamental Score
Score: 7/10 (Strong Earnings Momentum)
Explanation: Based on Q3 2025 blended earnings growth estimate of 43.4% year-over-year (ex-energy: 42.4%). Of early reporters, 76.9% beat expectations. Small-caps like US2000 benefit from domestic focus, with Q3/Q4 growth projected at 43% and 73.8% – indicates healthy corporate profits driving upside potential, though sensitive to rate changes.
🌍 Step 3: Macro Score Points
Score: 6/10 (Stable but Shutdown-Impacted)
Explanation: Combines key US economic feeds. GDP Q3 estimate at 3.8% annualized growth supports small-cap expansion, but government shutdown risks data delays and fiscal uncertainty. Inflation at 2.9% (August CPI) is cooling toward Fed's 2% target, easing pressure on small firms with high debt. Overall, macro favors resilience if shutdown resolves quickly.
🗓️ Step 4: Seasonal Tendencies
October Historical Performance: Average -0.5% monthly return (1989-2025 data)
Explanation: September-October window often sees volatility from historical events (e.g., portfolio rebalancing, fiscal year-end). Russell 2000 averages slight downside in October, but Q4 rebounds 74% of time with +2.8% gains – watch for "Santa rally" buildup if earnings hold strong. Simple takeaway: Enter cautiously early-month, scale in on dips.
💰 Step 5: Key Macro Rates
Interest Rates: Fed Funds at 4.25% (post-September cut)
Explanation: Recent 0.25% cut boosts small-caps (40% more floating-rate debt than large-caps), freeing ~$15B in cash flow. Markets price 100% chance of October cut, 88% for December – lowers borrowing costs, aiding US2000 growth stocks.
Inflation Rates: 2.9% YoY (August CPI; September data due October 15)
Explanation: Up from 2.7%, but food-at-home CPI +2.7% shows moderation. Cooling trend reduces Fed hike risks, benefiting rate-sensitive small-caps without overheating economy.
GDP Rates: 3.8% annualized (Q3 nowcast; Q2 actual +3.8%)
Explanation: Steady expansion from consumer spending and AI investments. Small-caps thrive in domestic GDP upticks, but Q1 contraction (-0.6%) highlights cycle risks – current feed signals soft landing.
🏦 Step 6: Bank Orders Flow
Latest Flow: Neutral to Bullish (Institutional accumulation in weakness)
Explanation: H.8 Fed report (October 3) shows stable commercial bank assets/liabilities; no major small-cap drawdown. Footprint delta shows positive buying (more ask-traded volume) despite price dips – banks positioning for rate cuts, with hedge funds shorting less aggressively. Simple view: Flows support longs if volatility eases.
😊 Step 7: Trader Sentiment Outlook
Retail Traders: 55% Bullish (Net long bias)
Explanation: Retail leans optimistic on small-cap rotation post-rate cuts; AAII surveys show rising bulls amid earnings beats. Measures mood via options volume – put/call ratio below 1 signals confidence, but high leverage risks quick shifts.
Institutional Traders: 60% Bullish (Accumulating on dips)
Explanation: Big players (hedge funds, pensions) show positive delta divergence – buying weakness while hedging volatility. CFTC data implies reduced shorts; 69% of retail CFD accounts lose on leverage, so institutions dominate flow for sustained moves.
📈 Step 8: Overall Investor Mood Measures
Fear & Greed Index: 54 (Neutral)
Explanation: CNN gauge blends volatility (VIX low), momentum (above 125-day average), and breadth (more highs than lows). Neutral means balanced risk – not extreme fear (buy signal) or greed (sell warning). Ties to US2000: Steady mood supports small-cap parity with large-caps in Q3.
🐂 Step 9: Overall Market Outlook Score
Score: Bull (Long) – 65/100
Explanation: Earnings surge + rate cuts outweigh seasonal dips and shutdown noise. Small-caps like US2000 lead rotation (Q3 parity with S&P 500); mood neutral but flows bullish. As trader correction: Focus on reopen volatility – long CFDs on pullbacks, but hedge with stops given 69% retail loss rate on these instruments.
💰 Money-Making Analysis
• Forex💹
• Indices📈
• Crypto ₿
• Commodities⚡
• Stocks🏦
• Fundamental + Macro📊
• Sentiment🔎
👉 Ask what analysis you need & get it FREE!
Join Discord for signals + data & grab the Master Plan: discord.gg/ZQS3y7FhVr
• Forex💹
• Indices📈
• Crypto ₿
• Commodities⚡
• Stocks🏦
• Fundamental + Macro📊
• Sentiment🔎
👉 Ask what analysis you need & get it FREE!
Join Discord for signals + data & grab the Master Plan: discord.gg/ZQS3y7FhVr
Powiązane publikacje
Wyłączenie odpowiedzialności
Informacje i publikacje nie stanowią i nie powinny być traktowane jako porady finansowe, inwestycyjne, tradingowe ani jakiekolwiek inne rekomendacje dostarczane lub zatwierdzone przez TradingView. Więcej informacji znajduje się w Warunkach użytkowania.