Short
US 100 (A BEARISH PATTERN)
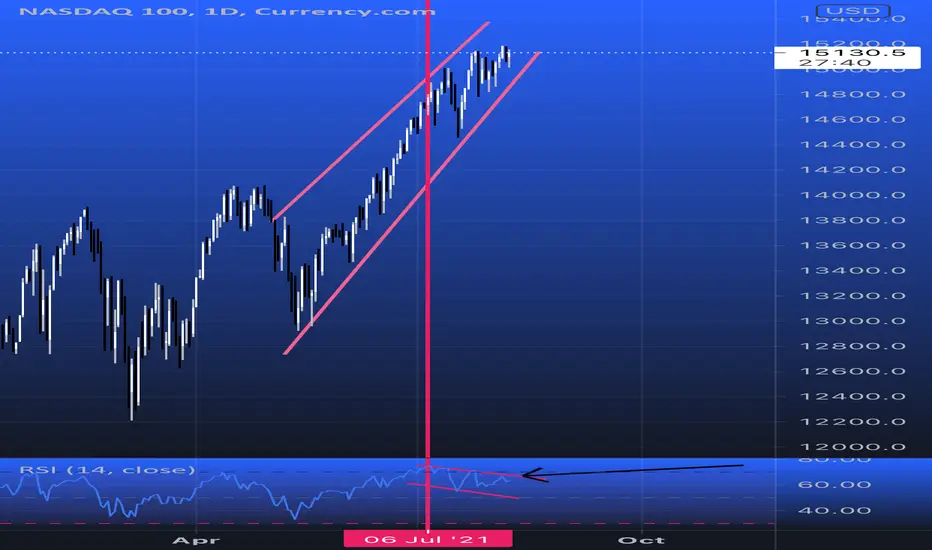
Here we can see clearly the US Index seems to have formed a double top (M), a bearish pattern, on the daily time frame. The RSI indicator is also showing us a Divergence down trend from the actual chart + it’s also near the overbought territory.
Keep an eye on the US INDEX over coming days or week. Happy pip hunting traders.
Keep an eye on the US INDEX over coming days or week. Happy pip hunting traders.
Powiązane publikacje
Wyłączenie odpowiedzialności
Informacje i publikacje przygotowane przez TradingView lub jego użytkowników, prezentowane na tej stronie, nie stanowią rekomendacji ani porad handlowych, inwestycyjnych i finansowych i nie powinny być w ten sposób traktowane ani wykorzystywane. Więcej informacji na ten temat znajdziesz w naszym Regulaminie.