UPL Limited - #Breakout Setup After #Accumulation Phase
Current Price: 691.07
Good For Swing to Short-term Trading.
Technical Summary:
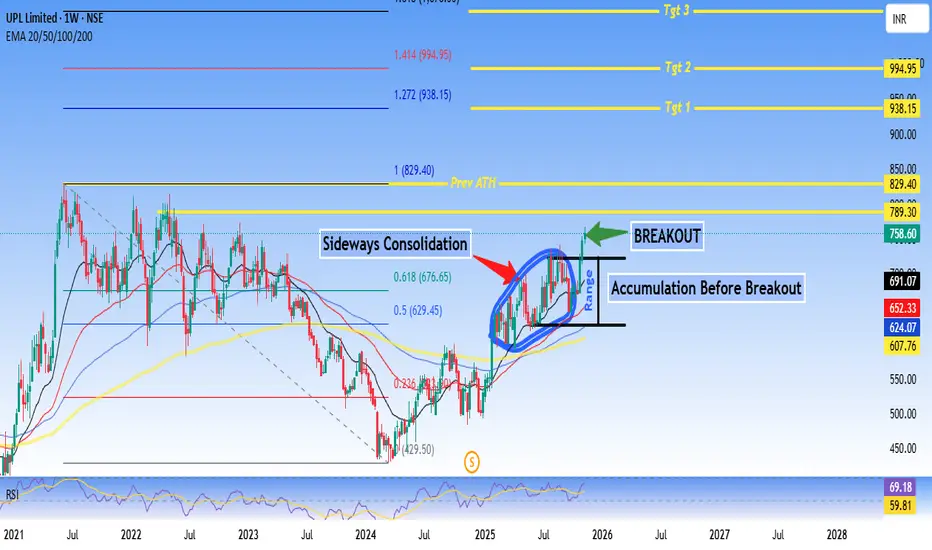
UPL is showing a classic accumulation-to-breakout pattern after an extended sideways #consolidation phase. The stock has broken out from a well-defined range with strong volume confirmation and is now positioned for potential upside momentum.
Key Technical Highlights:
✅ Breakout Confirmed: Price breaking above 768 resistance zone with volume expansion
✅ Accumulation Phase Complete: Extended consolidation (2024-2025) suggesting smart money accumulation
✅ EMA Alignment: 20/50/100/200 EMAs converging and starting to fan out bullishly
✅ RSI Strength: At 69.18, showing momentum without being overbought
✅ Fibonacci Levels: Currently between 0.236-0.5 retracement, plenty of upside room
Price Targets:
- Target 1: 938.15 (+35% from current levels)
- Target 2: 994.95 (+44%)
- Target 3: 1,050+ (Extended target)
Support Levels:
- Immediate: 676 (0.618 Fib)
- Strong: 629 (0.5 Fib + breakout level)
- Critical: 607 (20 EMA)
Risk-Reward: Favorable at current levels with defined support zones and multiple upside targets.
Disclaimer:
This analysis is for educational and informational purposes only and should NOT be considered as financial advice or a recommendation to buy/sell any security.
- Technical analysis is based on historical price patterns and may not predict future performance - Past performance is not indicative of future results - Trading and investing involve substantial risk of loss - Always conduct your own research and due diligence - The author may or may not hold positions in the discussed security - Price targets are projections based on technical levels and not guaranteed outcomes - Market conditions can change rapidly, invalidating technical setups - Use appropriate position sizing and risk management strategies
** Trade at your own risk. You are solely responsible for your trading/investment decisions.**
#UPL #TechnicalAnalysis #Breakout #Accumulation #StockMarket #NSE #SwingTrading #ChemicalSector #FibonacciRetracement #RSI
Current Price: 691.07
Good For Swing to Short-term Trading.
Technical Summary:
UPL is showing a classic accumulation-to-breakout pattern after an extended sideways #consolidation phase. The stock has broken out from a well-defined range with strong volume confirmation and is now positioned for potential upside momentum.
Key Technical Highlights:
✅ Breakout Confirmed: Price breaking above 768 resistance zone with volume expansion
✅ Accumulation Phase Complete: Extended consolidation (2024-2025) suggesting smart money accumulation
✅ EMA Alignment: 20/50/100/200 EMAs converging and starting to fan out bullishly
✅ RSI Strength: At 69.18, showing momentum without being overbought
✅ Fibonacci Levels: Currently between 0.236-0.5 retracement, plenty of upside room
Price Targets:
- Target 1: 938.15 (+35% from current levels)
- Target 2: 994.95 (+44%)
- Target 3: 1,050+ (Extended target)
Support Levels:
- Immediate: 676 (0.618 Fib)
- Strong: 629 (0.5 Fib + breakout level)
- Critical: 607 (20 EMA)
Risk-Reward: Favorable at current levels with defined support zones and multiple upside targets.
Disclaimer:
This analysis is for educational and informational purposes only and should NOT be considered as financial advice or a recommendation to buy/sell any security.
- Technical analysis is based on historical price patterns and may not predict future performance - Past performance is not indicative of future results - Trading and investing involve substantial risk of loss - Always conduct your own research and due diligence - The author may or may not hold positions in the discussed security - Price targets are projections based on technical levels and not guaranteed outcomes - Market conditions can change rapidly, invalidating technical setups - Use appropriate position sizing and risk management strategies
** Trade at your own risk. You are solely responsible for your trading/investment decisions.**
#UPL #TechnicalAnalysis #Breakout #Accumulation #StockMarket #NSE #SwingTrading #ChemicalSector #FibonacciRetracement #RSI
Powiązane publikacje
Wyłączenie odpowiedzialności
Informacje i publikacje nie stanowią i nie powinny być traktowane jako porady finansowe, inwestycyjne, tradingowe ani jakiekolwiek inne rekomendacje dostarczane lub zatwierdzone przez TradingView. Więcej informacji znajduje się w Warunkach użytkowania.