Here's the explanation.
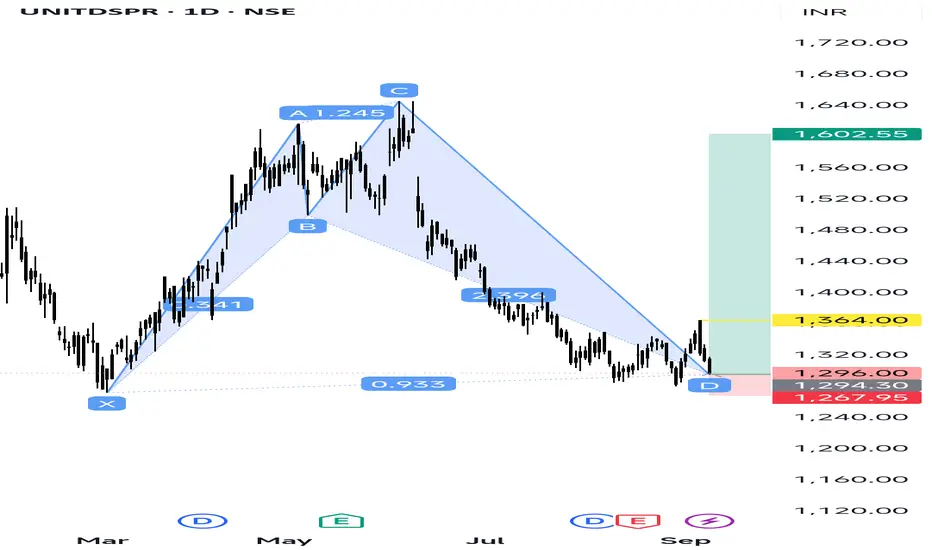
X to A: Initial strong rally.
A to B: Price retraced to ~0.886 of XA (fits Shark criteria).
B to C: A strong bullish move – extended to above 1.13 of AB.
C to D: A deep retracement, falling back close to 0.886–1.13 zone of XA → forming the Potential Reversal Zone (PRZ).
Now, the price is sitting around D (1296), which is the completion zone.
---
🔹 Trading Plan (General)
1. Entry:
Around Point D (1290–1300 zone) if reversal signs (bullish candles, RSI divergence, volume support) are visible.
2. Targets:
T1 → 1364 (first resistance / yellow line on chart)
T2 → 1500–1520
T3 → 1602 (green zone marked)
3. Stop Loss:
Below 1267 (red zone marked). If price closes below, pattern fails.
Wyłączenie odpowiedzialności
Informacje i publikacje przygotowane przez TradingView lub jego użytkowników, prezentowane na tej stronie, nie stanowią rekomendacji ani porad handlowych, inwestycyjnych i finansowych i nie powinny być w ten sposób traktowane ani wykorzystywane. Więcej informacji na ten temat znajdziesz w naszym Regulaminie.