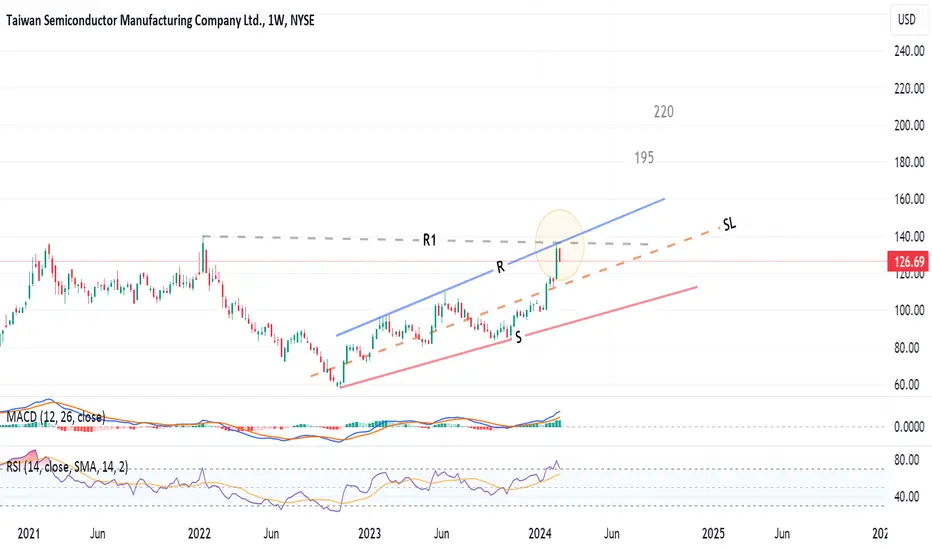
Weekly chart, the stock reached a cluster of resistances R1 and R, and could not cross.
There is a tendency to test the mid line or the support line S
Above the R line, a rising expanding wedge pattern will be completed, and the target will be 195 then 220
Stop loss below SL line
There is a tendency to test the mid line or the support line S
Above the R line, a rising expanding wedge pattern will be completed, and the target will be 195 then 220
Stop loss below SL line
Wyłączenie odpowiedzialności
Informacje i publikacje nie stanowią i nie powinny być traktowane jako porady finansowe, inwestycyjne, tradingowe ani jakiekolwiek inne rekomendacje dostarczane lub zatwierdzone przez TradingView. Więcej informacji znajduje się w Warunkach użytkowania.
Wyłączenie odpowiedzialności
Informacje i publikacje nie stanowią i nie powinny być traktowane jako porady finansowe, inwestycyjne, tradingowe ani jakiekolwiek inne rekomendacje dostarczane lub zatwierdzone przez TradingView. Więcej informacji znajduje się w Warunkach użytkowania.