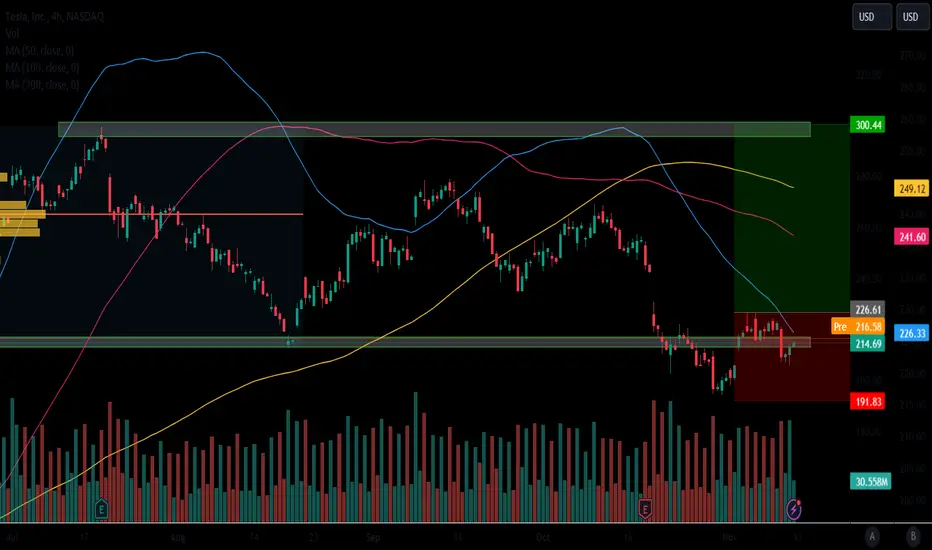
Tesla is in a falling trend channel in the medium long term. This signals increasing pessimism among investors and indicates further decline for Tesla. The stock gave a negative signal from the double top formation by the break down through the support at 215. Further fall to 163 or lower is signaled. The stock is testing support at dollar 214. This could give a positive reaction, but a downward breakthrough of dollar 214 means a negative signal. The volume balance is negative and weakens the stock in the short term. The RSI curve shows a falling trend, which supports the negative trend.
Price Momentum
TSLA is trading in the middle of its 52-week range and below its 200-day simple moving average.
What does this mean?
Investors are still evaluating the share price, but the stock still appears to have some downward momentum.
Price Momentum
TSLA is trading in the middle of its 52-week range and below its 200-day simple moving average.
What does this mean?
Investors are still evaluating the share price, but the stock still appears to have some downward momentum.
⭐⭐⭐ Sign Up for Free ⭐⭐⭐
1) Download our Mobile App >> link-to.app/dexwirenews
2) Join our Telegram >> t.me/DEXWireNews
3) Sign Up for Text Alerts >>
dexwirenews.com/TEXT
4) Follow @DEXWireNews on Social Media
1) Download our Mobile App >> link-to.app/dexwirenews
2) Join our Telegram >> t.me/DEXWireNews
3) Sign Up for Text Alerts >>
dexwirenews.com/TEXT
4) Follow @DEXWireNews on Social Media
Wyłączenie odpowiedzialności
Informacje i publikacje przygotowane przez TradingView lub jego użytkowników, prezentowane na tej stronie, nie stanowią rekomendacji ani porad handlowych, inwestycyjnych i finansowych i nie powinny być w ten sposób traktowane ani wykorzystywane. Więcej informacji na ten temat znajdziesz w naszym Regulaminie.