📊 TSLA Technical Analysis (Daily Timeframe)
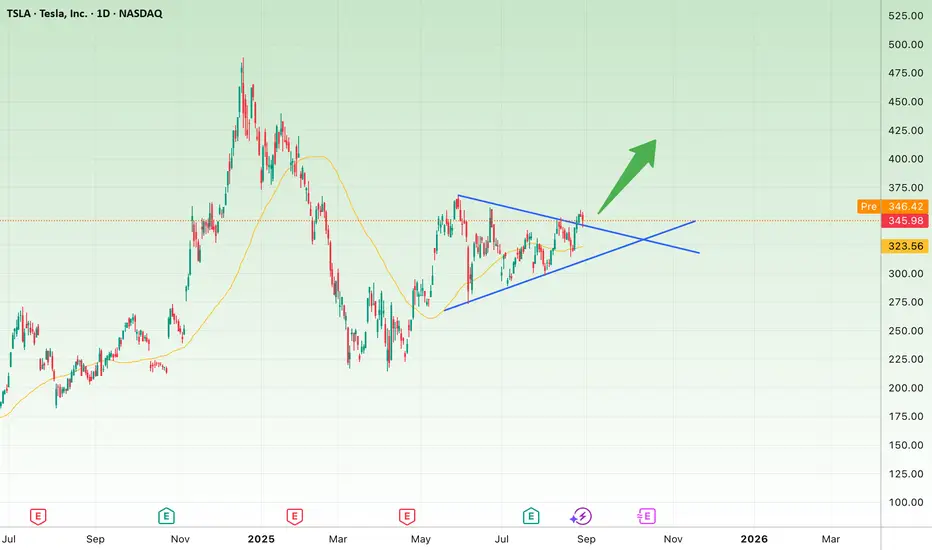
After a period of consolidation inside a Symmetrical Triangle, Tesla’s price is now showing a potential breakout to the upside. This could be an early signal for the beginning of a new bullish wave.
🔹 Key Support: $323 – $325
🔹 Next Resistances: $375 and, if broken, higher targets at $400 – $420
The 50-day moving average is currently supporting the uptrend, and a confirmed close above the $346 level would strengthen the bullish outlook.
⚠️ However, if the price fails and breaks below $323, the bullish scenario may lose validity and a corrective move could follow.
Wyłączenie odpowiedzialności
Informacje i publikacje przygotowane przez TradingView lub jego użytkowników, prezentowane na tej stronie, nie stanowią rekomendacji ani porad handlowych, inwestycyjnych i finansowych i nie powinny być w ten sposób traktowane ani wykorzystywane. Więcej informacji na ten temat znajdziesz w naszym Regulaminie.