🔎Understanding How Stocks React at Key Volume Profile Levels
In this post, let’s study how a stock can react around important Volume Profile levels and how we, as traders, can take advantage of this behavior.
🔘A Quick Look at Volume Profile
The Volume Profile shows how much trading took place at each price level. Think of it like a sideways histogram that highlights where buyers and sellers were most active. It helps identify price zones that the market accepted (heavy trading) and those it rejected (light trading).
In between a Volume Profile is the Point of Control (POC) - the price level where the highest trading volume occurred. This is often considered as the market’s fair value zone, where buyers and sellers found the most agreement.

The POC tends to act like a magnet for price. When price moves too far away from it, it often returns to test that level since it represents strong trading interest. That’s why traders use POC zones to mark key supports, resistances, and potential entry areas.
🔘Overview: TSLA’s Story
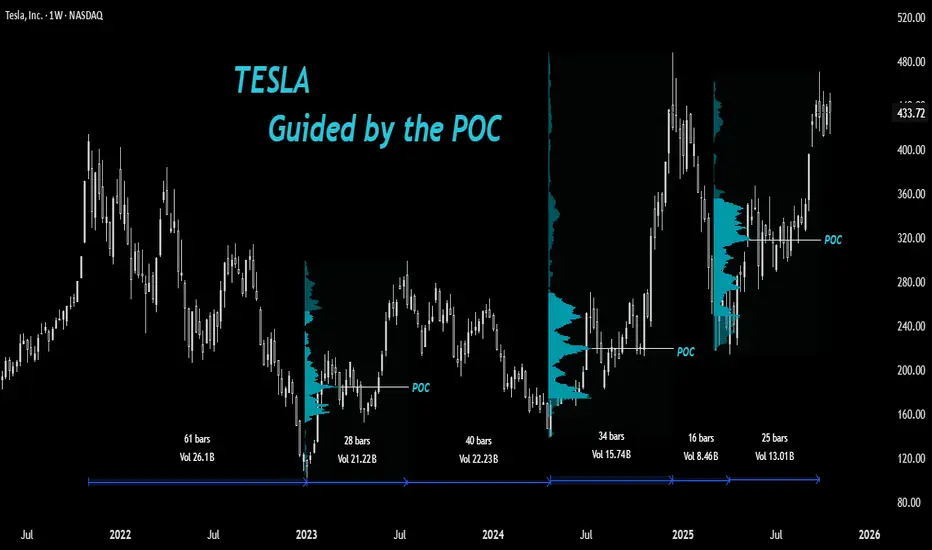
After printing a high of $414 in 2021, Tesla (TSLA) has been trying to decisively break that level for almost four years. It made two attempts - first in December 2024, which was quickly faded, and again in September 2025.
🔘The Fall and Bottom Formation
The stock went through a major bearish phase from $414 down to $101 in 2022 - a massive 75% drop. Then came a sharp V-shaped rally from the bottom - a 194% rise over about 28 weeks, retracing roughly 60% of the entire fall in a short span.

🔘Why It’s Hard to Catch the Bottom
Catching a stock at the exact bottom is one of the hardest things in trading. No one really knows when the real bottom is forming.
At that point, fear is high, sentiment is negative, and the trend still looks weak. Most traders wait for confirmation - but by then, the bottom is already behind.
Catching the exact low becomes more like a luck than skill. No doubt 'smart traders' focus on catching the early reversal and not the perfect bottom, there are others who wait for pullback opportunities to a fair price.
🔘April 2024 Bottom Formation
After rallying sharply, TSLA began to pull back from around $300 in July 2023. Traders who had missed the earlier move were waiting patiently with their limit orders for a healthy correction.
But the question was - where should those limit orders be placed?
◽️At the breakout zone around $218?
◽️Near the 50% or 61.8% Fibonacci retracement?
◽️Or below the April 2023 low near $152 for a possible liquidity grab?

The truth is - nobody actually knows the exact level because nothing works all the time.
However, the POC can often help identify a probable fair value zone where accumulation tends to happen.
And that’s exactly what happened in April 2024. The stock dipped below the previous rally’s POC, grabbed liquidity under $152, and then reversed sharply.
🔘The Sharp Rally to New Highs
After that, TSLA entered a strong bullish phase, rallying from the April 2024 low to new highs above $414 in December 2024 - a massive 252% rise.

A question here arises: Was this rally sustainable above previous highs?
🔘The Quick Fall
In January 2025, the stock saw a sharp fall from $488, wiping out 78% of the previous rally.
Interestingly, this decline didn’t stop at a typical breakout retest level - instead, it halted exactly at the POC of the prior bullish rally and began consolidating there.

Since then, the stock has climbed back near its previous highs.
But note this - the January 2025 fall lasted only 16 weeks, while the recovery has taken over 25 weeks without new highs, suggesting a slight loss of upside momentum compared to earlier rallies (early 2023 and late 2024)
🔘What to Watch Next
If TSLA pulls back again in the future, we can draw a new Volume Profile over the latest bullish leg to locate its POC (I have drawn till the current high of the rally)
That level could once again serve as a potential fair value area and possibly repeat the same price behavior we’ve seen before.
What is your thought on point of control as a tool for investment purpose?
Share your views and hit the boost for more educational posts in future.
📣Disclaimer:
Everything shared here is meant for education and general awareness only. It’s not financial advice, nor a recommendation to buy, sell, or hold any asset. Do your own research, manage your risk, and make sure you understand what you’re getting into.
Your money, your responsibility; and if you’re unsure, ask a qualified financial professional. (Or at least run it by your pet - they’re great listeners 🐶).
In this post, let’s study how a stock can react around important Volume Profile levels and how we, as traders, can take advantage of this behavior.
🔘A Quick Look at Volume Profile
The Volume Profile shows how much trading took place at each price level. Think of it like a sideways histogram that highlights where buyers and sellers were most active. It helps identify price zones that the market accepted (heavy trading) and those it rejected (light trading).
In between a Volume Profile is the Point of Control (POC) - the price level where the highest trading volume occurred. This is often considered as the market’s fair value zone, where buyers and sellers found the most agreement.
The POC tends to act like a magnet for price. When price moves too far away from it, it often returns to test that level since it represents strong trading interest. That’s why traders use POC zones to mark key supports, resistances, and potential entry areas.
In short:
The Volume Profile shows where trading happened. The POC shows where it mattered the most.
🔘Overview: TSLA’s Story
After printing a high of $414 in 2021, Tesla (TSLA) has been trying to decisively break that level for almost four years. It made two attempts - first in December 2024, which was quickly faded, and again in September 2025.
🔘The Fall and Bottom Formation
The stock went through a major bearish phase from $414 down to $101 in 2022 - a massive 75% drop. Then came a sharp V-shaped rally from the bottom - a 194% rise over about 28 weeks, retracing roughly 60% of the entire fall in a short span.
🔘Why It’s Hard to Catch the Bottom
Catching a stock at the exact bottom is one of the hardest things in trading. No one really knows when the real bottom is forming.
At that point, fear is high, sentiment is negative, and the trend still looks weak. Most traders wait for confirmation - but by then, the bottom is already behind.
Catching the exact low becomes more like a luck than skill. No doubt 'smart traders' focus on catching the early reversal and not the perfect bottom, there are others who wait for pullback opportunities to a fair price.
🔘April 2024 Bottom Formation
After rallying sharply, TSLA began to pull back from around $300 in July 2023. Traders who had missed the earlier move were waiting patiently with their limit orders for a healthy correction.
But the question was - where should those limit orders be placed?
◽️At the breakout zone around $218?
◽️Near the 50% or 61.8% Fibonacci retracement?
◽️Or below the April 2023 low near $152 for a possible liquidity grab?
The truth is - nobody actually knows the exact level because nothing works all the time.
However, the POC can often help identify a probable fair value zone where accumulation tends to happen.
Although we can’t pinpoint the exact level where a pullback will end, the area 'around' the POC often serves as one of the most reliable zones to accumulate a bullish stock.
And that’s exactly what happened in April 2024. The stock dipped below the previous rally’s POC, grabbed liquidity under $152, and then reversed sharply.
🔘The Sharp Rally to New Highs
After that, TSLA entered a strong bullish phase, rallying from the April 2024 low to new highs above $414 in December 2024 - a massive 252% rise.
If you observe the Range Tool on the chart, you’ll notice a pattern - bearish phases take longer, while bullish rallies happen faster.
A question here arises: Was this rally sustainable above previous highs?
🔘The Quick Fall
In January 2025, the stock saw a sharp fall from $488, wiping out 78% of the previous rally.
Interestingly, this decline didn’t stop at a typical breakout retest level - instead, it halted exactly at the POC of the prior bullish rally and began consolidating there.
Since then, the stock has climbed back near its previous highs.
But note this - the January 2025 fall lasted only 16 weeks, while the recovery has taken over 25 weeks without new highs, suggesting a slight loss of upside momentum compared to earlier rallies (early 2023 and late 2024)
🔘What to Watch Next
If TSLA pulls back again in the future, we can draw a new Volume Profile over the latest bullish leg to locate its POC (I have drawn till the current high of the rally)
That level could once again serve as a potential fair value area and possibly repeat the same price behavior we’ve seen before.
What is your thought on point of control as a tool for investment purpose?
Share your views and hit the boost for more educational posts in future.
📣Disclaimer:
Everything shared here is meant for education and general awareness only. It’s not financial advice, nor a recommendation to buy, sell, or hold any asset. Do your own research, manage your risk, and make sure you understand what you’re getting into.
Your money, your responsibility; and if you’re unsure, ask a qualified financial professional. (Or at least run it by your pet - they’re great listeners 🐶).
JJ Singh
Trader/Investor
Moderator, TradingView
🚀Join t.me/jjsingh_2020 ,
A Free Education channel
🚀Tweet at twitter.com/JaySingh_2020
Trader/Investor
Moderator, TradingView
🚀Join t.me/jjsingh_2020 ,
A Free Education channel
🚀Tweet at twitter.com/JaySingh_2020
Powiązane publikacje
Wyłączenie odpowiedzialności
Informacje i publikacje przygotowane przez TradingView lub jego użytkowników, prezentowane na tej stronie, nie stanowią rekomendacji ani porad handlowych, inwestycyjnych i finansowych i nie powinny być w ten sposób traktowane ani wykorzystywane. Więcej informacji na ten temat znajdziesz w naszym Regulaminie.