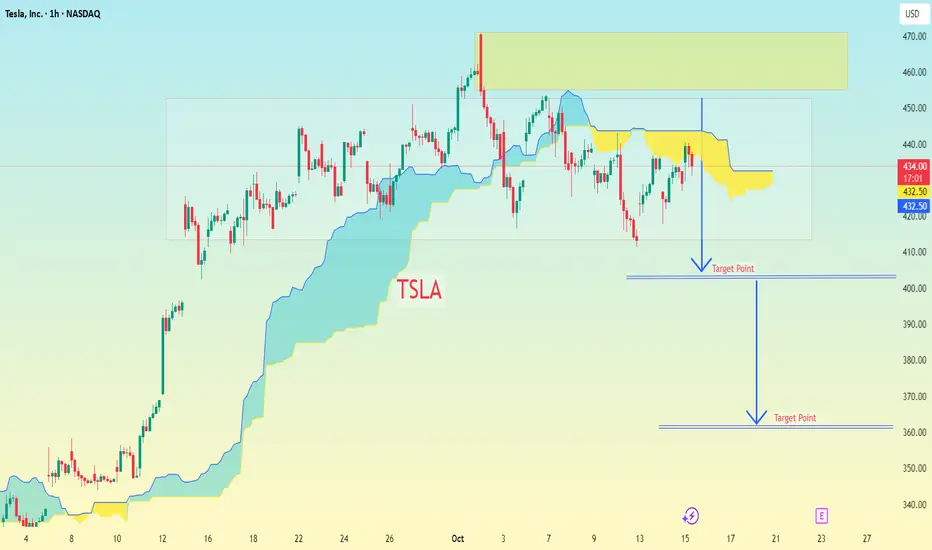
TSLA with Ichimoku Cloud and projected target points drawn below the current price.
Let’s break it down:
Current price on chart: around $434
Yellow zone (resistance): roughly $445–$465
First target line drawn: around $405–$410
Second (lower) target line drawn: around $365–$370
📊 Interpretation (based on my chart):
Target Level Approx. Price Meaning
1st Target $405–$410 Short-term support / take-profit zone
2nd Target $365–$370 Deeper correction / extended short target
⚠ Note:
These targets are based on my chart’s visual annotations, likely assuming price breaks below the Ichimoku cloud and moves toward lower support levels. This aligns with a bearish setup.
👉 Risk Management Tip:
If entering short, a stop loss just above the resistance zone ($450–$455) may be considered.
If entering long, these same levels can act as profit-taking or add-on zones.
Zlecenie aktywne
trade active 📲 Join telegram channel free .
t.me/addlist/dg3uSwzkMSplNjFk
Forex, Gold & Crypto Signals with detailed analysis & get consistent results.
t.me/addlist/dg3uSwzkMSplNjFk
Gold Signal's with proper TP & SL for high profit opportunities.
t.me/addlist/dg3uSwzkMSplNjFk
Forex, Gold & Crypto Signals with detailed analysis & get consistent results.
t.me/addlist/dg3uSwzkMSplNjFk
Gold Signal's with proper TP & SL for high profit opportunities.
Powiązane publikacje
Wyłączenie odpowiedzialności
Informacje i publikacje przygotowane przez TradingView lub jego użytkowników, prezentowane na tej stronie, nie stanowią rekomendacji ani porad handlowych, inwestycyjnych i finansowych i nie powinny być w ten sposób traktowane ani wykorzystywane. Więcej informacji na ten temat znajdziesz w naszym Regulaminie.
📲 Join telegram channel free .
t.me/addlist/dg3uSwzkMSplNjFk
Forex, Gold & Crypto Signals with detailed analysis & get consistent results.
t.me/addlist/dg3uSwzkMSplNjFk
Gold Signal's with proper TP & SL for high profit opportunities.
t.me/addlist/dg3uSwzkMSplNjFk
Forex, Gold & Crypto Signals with detailed analysis & get consistent results.
t.me/addlist/dg3uSwzkMSplNjFk
Gold Signal's with proper TP & SL for high profit opportunities.
Powiązane publikacje
Wyłączenie odpowiedzialności
Informacje i publikacje przygotowane przez TradingView lub jego użytkowników, prezentowane na tej stronie, nie stanowią rekomendacji ani porad handlowych, inwestycyjnych i finansowych i nie powinny być w ten sposób traktowane ani wykorzystywane. Więcej informacji na ten temat znajdziesz w naszym Regulaminie.