Altcoin Market Structure Outlook | ETH/BTC Rotation Analysis
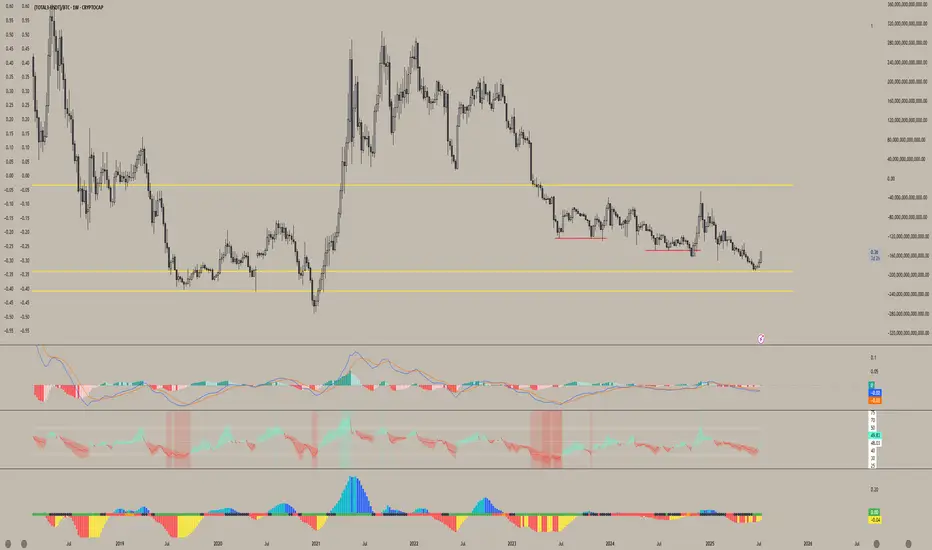
This chart outlines a cyclical framework I'm using to anticipate a potential bottom in altcoins heading into Q4. Currently, ETH is outperforming BTC, and altcoins are following its momentum - though many continue to make lower lows relative to ETH.D but as long as eth rallies I see Alts keeping up.
Historically, we've seen altcoin capitulation phases follow a two-stage structure: an initial local bottom in June/July, followed by a final sweep or structural low into October (Q4), as observed in both 2023 and 2024. Given this repeating seasonal pattern, I expect ETH to potentially retrace against BTC in Q4 making a higher low, which could set the stage for altcoins to make a lower low and retest their key range lows — particularly near the 0.25 ETH/BTC level.
Should ETH maintain a higher low and resume trend afterward, it would likely mark a rotation point where capital begins flowing into higher-beta altcoins. Coupled with potential macro tailwinds like rate cuts or dovish policy pivots, this scenario could trigger a strong altcoin rally from Q4 into Q1.
This chart aims to visualize that rotational capital flow and position sizing opportunity across the cycle.
Wyłączenie odpowiedzialności
Informacje i publikacje przygotowane przez TradingView lub jego użytkowników, prezentowane na tej stronie, nie stanowią rekomendacji ani porad handlowych, inwestycyjnych i finansowych i nie powinny być w ten sposób traktowane ani wykorzystywane. Więcej informacji na ten temat znajdziesz w naszym Regulaminie.