Inverse H&S Forming on Daily TF – Price Testing Resistance Trendline. What’s Next?
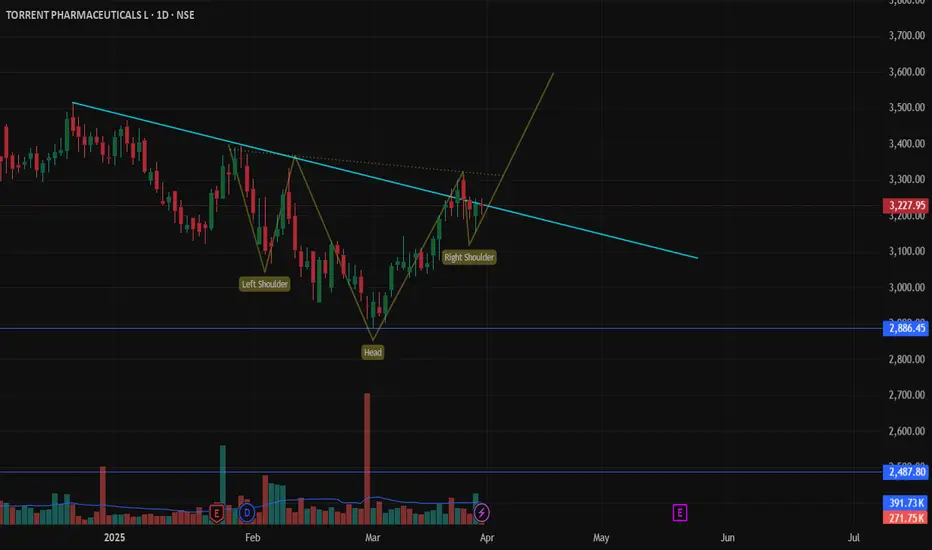
An Inverse Head & Shoulders (H&S) pattern is taking shape on the daily chart, suggesting a potential bullish reversal. Price is now testing a key resistance trendline—will it break through?
🔹 Bullish Confirmation: A breakout above resistance could confirm the pattern, targeting higher levels.
🔹 Bearish Rejection: If price gets rejected, the setup may fail, leading to a retest of nearest support.
Key Levels: Neckline (resistance) & trendline breakout zone. Thoughts? #PriceAction #TradingSetup
Wyłączenie odpowiedzialności
Informacje i publikacje nie stanowią i nie powinny być traktowane jako porady finansowe, inwestycyjne, tradingowe ani jakiekolwiek inne rekomendacje dostarczane lub zatwierdzone przez TradingView. Więcej informacji znajduje się w Warunkach użytkowania.
Wyłączenie odpowiedzialności
Informacje i publikacje nie stanowią i nie powinny być traktowane jako porady finansowe, inwestycyjne, tradingowe ani jakiekolwiek inne rekomendacje dostarczane lub zatwierdzone przez TradingView. Więcej informacji znajduje się w Warunkach użytkowania.