Titan Company Ltd – Symmetrical Triangle Breakout on the Hourly Chart
 TITAN
TITAN
📈 Pattern & Setup:
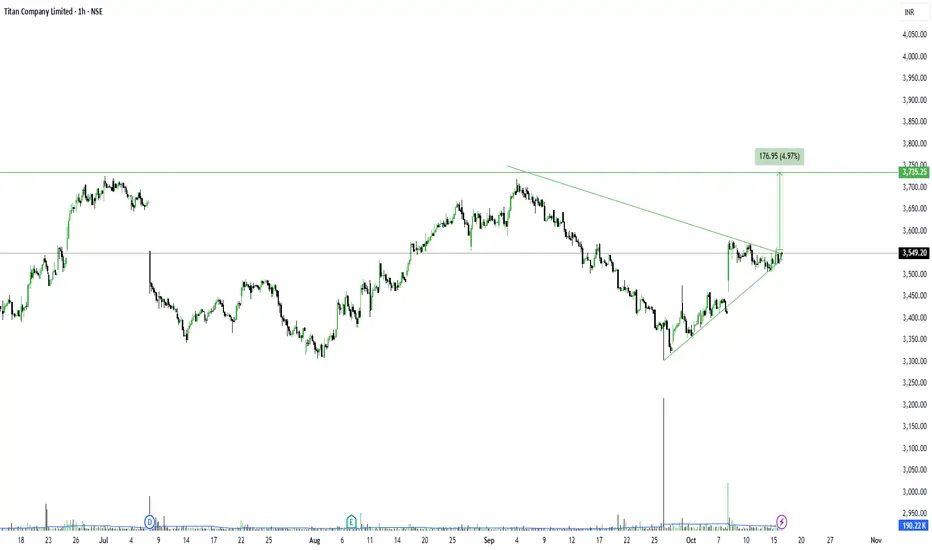
Titan is forming a clean symmetrical triangle pattern on the hourly chart after a corrective phase. The price has started compressing within tighter highs and higher lows, indicating reduced volatility before a potential expansion.
Now, the stock is approaching the apex of the triangle near 3550 levels — a zone that often precedes a decisive breakout. A breakout above 3560–3570 could trigger a sharp rally, targeting previous swing highs around 3730+.
The structure suggests quiet accumulation with energy being stored for the next impulsive leg.
📝 Trade Plan:
✍Entry: Above 3570 (breakout confirmation)
🚩Stop-Loss: 3470 (below trendline support)
🎯Targets:
Target 1 → 3660
Target 2 → 3750 (5% potential move)
💡 Pyramiding Strategy:
1. Enter 60% position above 3570
2. Add 40% more above 3600 on volume expansion
3. Trail stop-loss to 3520 once price sustains above 3660
🧠 Logic Behind Selecting this Trade:
After a steady retracement from 3800+, Titan has found base support and is now compressing near breakout levels. The converging structure hints at a potential trend reversal on shorter timeframes, aligning with sectoral strength in consumer discretionary.
A breakout here could also mark a continuation of Titan’s long-term bullish trend from the weekly chart.
Keep Learning. Keep Earning.
Let’s grow together 📚🎯
🔴Disclaimer:
This analysis is for educational purposes only. Not a buy/sell recommendation. Please do your own research or consult your financial advisor before trading.
📈 Pattern & Setup:
Titan is forming a clean symmetrical triangle pattern on the hourly chart after a corrective phase. The price has started compressing within tighter highs and higher lows, indicating reduced volatility before a potential expansion.
Now, the stock is approaching the apex of the triangle near 3550 levels — a zone that often precedes a decisive breakout. A breakout above 3560–3570 could trigger a sharp rally, targeting previous swing highs around 3730+.
The structure suggests quiet accumulation with energy being stored for the next impulsive leg.
📝 Trade Plan:
✍Entry: Above 3570 (breakout confirmation)
🚩Stop-Loss: 3470 (below trendline support)
🎯Targets:
Target 1 → 3660
Target 2 → 3750 (5% potential move)
💡 Pyramiding Strategy:
1. Enter 60% position above 3570
2. Add 40% more above 3600 on volume expansion
3. Trail stop-loss to 3520 once price sustains above 3660
🧠 Logic Behind Selecting this Trade:
After a steady retracement from 3800+, Titan has found base support and is now compressing near breakout levels. The converging structure hints at a potential trend reversal on shorter timeframes, aligning with sectoral strength in consumer discretionary.
A breakout here could also mark a continuation of Titan’s long-term bullish trend from the weekly chart.
Keep Learning. Keep Earning.
Let’s grow together 📚🎯
🔴Disclaimer:
This analysis is for educational purposes only. Not a buy/sell recommendation. Please do your own research or consult your financial advisor before trading.
TrendX INC
Powiązane publikacje
Wyłączenie odpowiedzialności
Informacje i publikacje nie stanowią i nie powinny być traktowane jako porady finansowe, inwestycyjne, tradingowe ani jakiekolwiek inne rekomendacje dostarczane lub zatwierdzone przez TradingView. Więcej informacji znajduje się w Warunkach użytkowania.