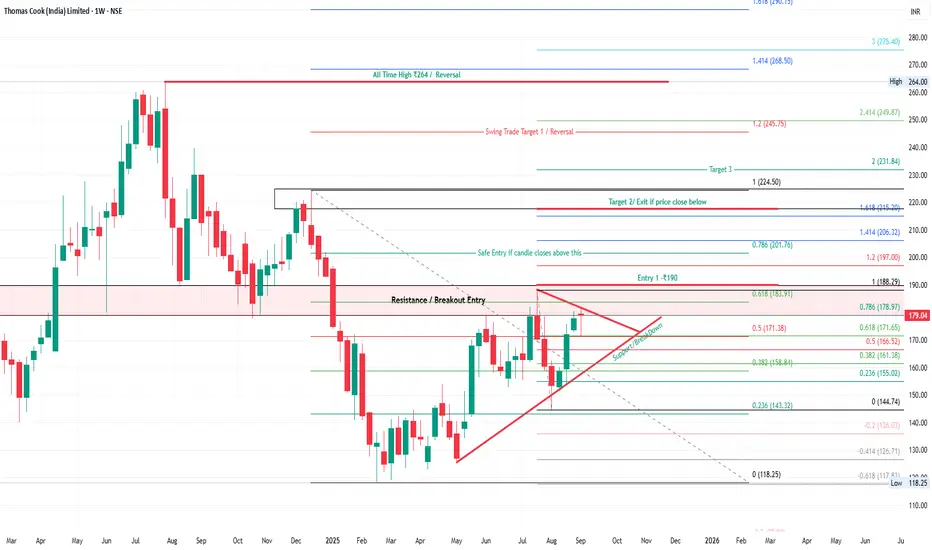
Thomas Cook is forming a triangle breakout structure on the weekly chart. Price is consolidating near resistance around ₹183–₹188. A weekly close above ₹190 will confirm breakout strength. Safe entry is above ₹190, with positional upside targets aligning with Fibonacci extensions.
📌 Key Technical Highlights:
Pattern: Symmetrical Triangle Breakout
Entry Zone: ₹183–₹190
Safe Entry: Above ₹190 on weekly close
Resistance Zone: ₹188–₹197
Support: ₹171, ₹158, ₹143
🎯 Upside Target Levels:
Target 1: ₹197
Target 2: ₹215
Target 3: ₹224
Target 4: ₹231
Swing Targets: ₹245 – ₹249
All-Time High: ₹264 (major reversal level)
⚠️ Downside Risk Levels:
₹171
₹158
₹143
₹118 (strong base support)
📈 Strategy Outlook:
Positional traders should wait for a strong weekly breakout above ₹190 for confirmation. Sustaining above this level can trigger momentum toward ₹224–₹245. A close below ₹171 weakens the setup.
Disclaimer:
This analysis is for educational purposes only and not financial advice. Do your own research before trading or investing.
Wyłączenie odpowiedzialności
Informacje i publikacje przygotowane przez TradingView lub jego użytkowników, prezentowane na tej stronie, nie stanowią rekomendacji ani porad handlowych, inwestycyjnych i finansowych i nie powinny być w ten sposób traktowane ani wykorzystywane. Więcej informacji na ten temat znajdziesz w naszym Regulaminie.