📍 Current Price & Range
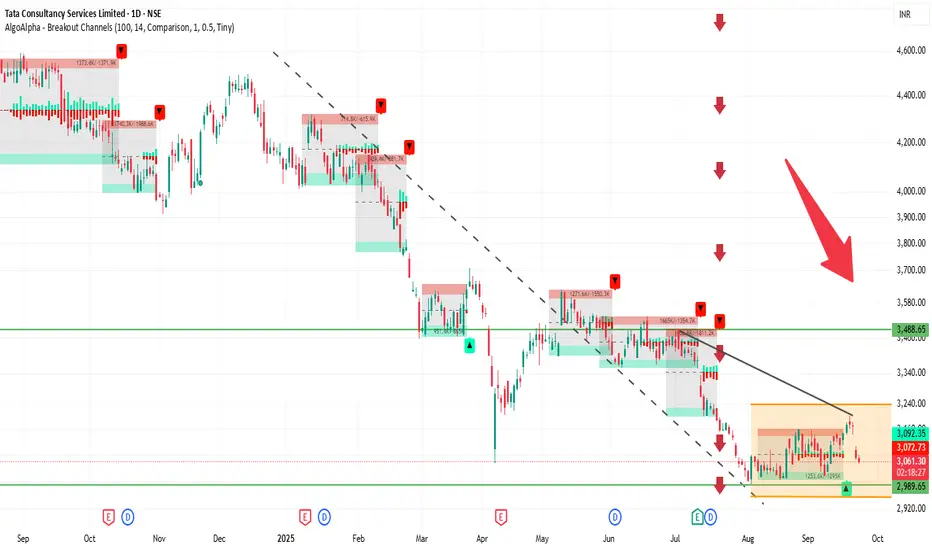
Current price: ₹3,063.80
Day’s High / Low: ₹3,106.90 / ₹3,052.00
52-week High / Low: ₹4,494.90 / ₹2,991.60
🔍 Key Levels
Immediate resistance: ₹3,100–₹3,110
Next resistance: ₹3,200–₹3,250
Immediate support: ₹3,050–₹3,060
Psychological / strong support: ₹3,000
📊 Indicators & Momentum
Price is just below near-term resistance, showing hesitation.
Short-term trend is neutral to slightly bearish; momentum is weak.
RSI and MACD suggest neutral to weak momentum, no strong reversal yet.
Stock is trading well below its 52-week high, indicating it has already corrected significantly.
🔮 Possible Scenarios
Bullish breakout → Sustaining above ₹3,110 could push price toward ₹3,200–₹3,250.
Sideways / consolidation → Likely to trade between ₹3,050–₹3,110 if no strong catalyst.
Bearish pullback → Breaking below ₹3,050 may take price toward ₹3,000, and further down to ₹2,950–₹2,900 if weakness continues.
👉 Outlook: At the current level (₹3,073.80), TCS is in a neutral zone. The next directional move depends on either a breakout above resistance or a fall below support.
Powiązane publikacje
Wyłączenie odpowiedzialności
Informacje i publikacje nie stanowią i nie powinny być traktowane jako porady finansowe, inwestycyjne, tradingowe ani jakiekolwiek inne rekomendacje dostarczane lub zatwierdzone przez TradingView. Więcej informacji znajduje się w Warunkach użytkowania.