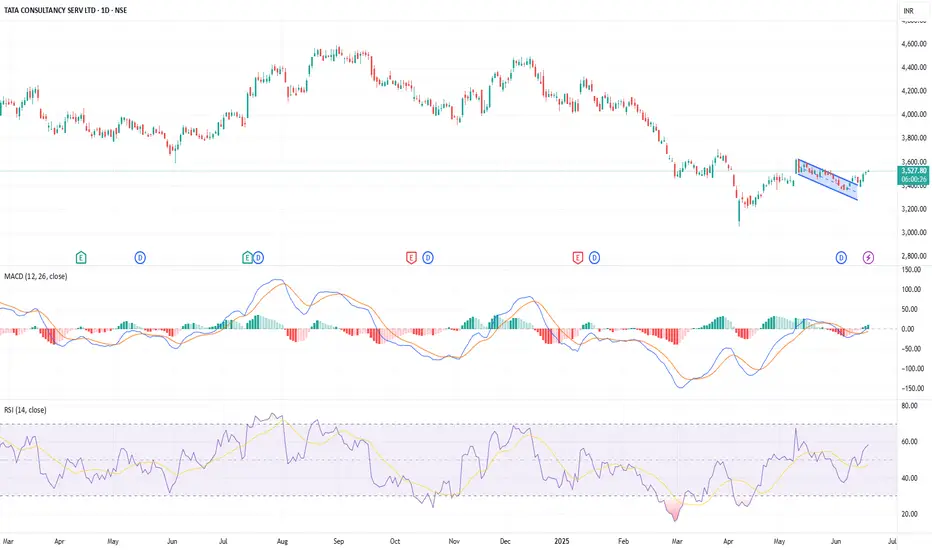
Breakout from a bullish falling wedge pattern and retesting the same breakout zone gives confidence of positive reversal probably. MACD crossover with rising histogram indicates strong momentum. RSI at 58.58, rising with room for further upside. Price sustaining above the wedge confirms breakout strength. Overall setup suggests a positive short-term trend continuation.
This is just for educational purpose and I am not giving any recommendation or target for TCS.
This is just for educational purpose and I am not giving any recommendation or target for TCS.
Powiązane publikacje
Wyłączenie odpowiedzialności
Informacje i publikacje nie stanowią i nie powinny być traktowane jako porady finansowe, inwestycyjne, tradingowe ani jakiekolwiek inne rekomendacje dostarczane lub zatwierdzone przez TradingView. Więcej informacji znajduje się w Warunkach użytkowania.