Topic Statement:
TCS has shown signs of recovery after a recent correction, with strong technical support levels reinforcing bullish potential.
Key Points:
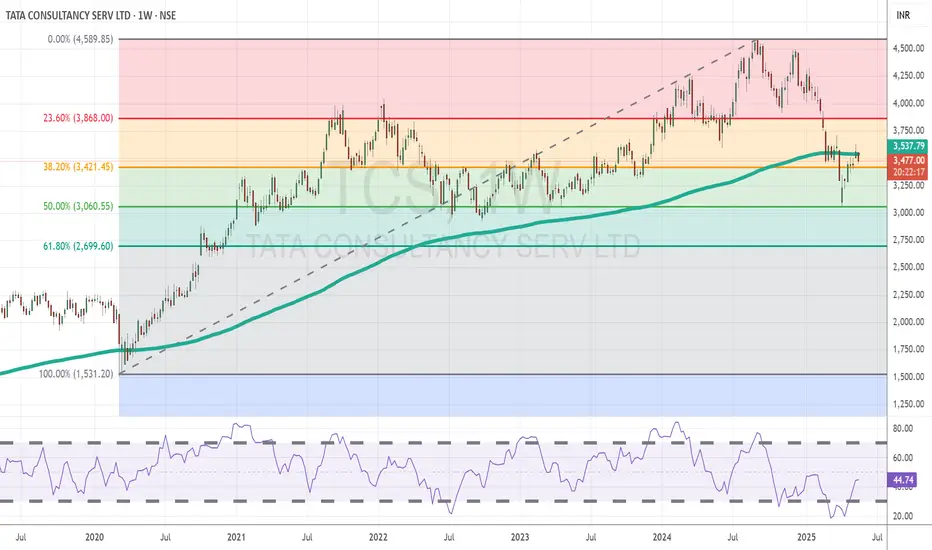
The price previously found strong and consistent support near the ₹3000 mark, reaffirmed during the recent market correction.
A full retracement to the 50% Fibonacci level** at ₹3060 attracted significant buying interest, highlighting renewed strength.
Currently, the stock trades just below the 200-day EMA, indicating it remains in oversold territory, but with potential for reversal if momentum continues.
TCS has shown signs of recovery after a recent correction, with strong technical support levels reinforcing bullish potential.
Key Points:
The price previously found strong and consistent support near the ₹3000 mark, reaffirmed during the recent market correction.
A full retracement to the 50% Fibonacci level** at ₹3060 attracted significant buying interest, highlighting renewed strength.
Currently, the stock trades just below the 200-day EMA, indicating it remains in oversold territory, but with potential for reversal if momentum continues.
Wyłączenie odpowiedzialności
Informacje i publikacje przygotowane przez TradingView lub jego użytkowników, prezentowane na tej stronie, nie stanowią rekomendacji ani porad handlowych, inwestycyjnych i finansowych i nie powinny być w ten sposób traktowane ani wykorzystywane. Więcej informacji na ten temat znajdziesz w naszym Regulaminie.