TATA POWER – Reversal Setup Near Key Support | Cup & Handle Retest
For Study Purpose Only
🕒 Timeframe: Weekly & Daily
💡 Pattern: Cup & Handle (trendline retest + neckline breakout)
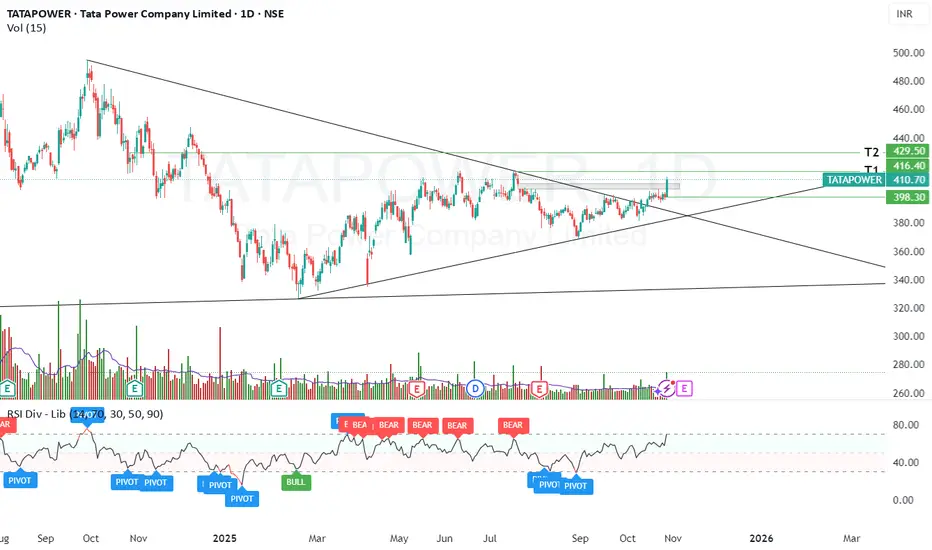
📈 Current Zone: ₹400–₹410
🎯 Targets: ₹418 / ₹430
⏳ Duration: 10–15 Days
🧭 Technical View:
On the weekly chart, Tata Power has taken support along the previous cup-and-handle trendline, right near the lower boundary of the handle, and has reversed upward from this level — suggesting a continuation of the larger bullish structure.
On the daily chart, the stock has delivered a clean neckline breakout while also filling the earlier runaway gap in the ₹400–₹410 zone. This gap fill acts as a successful retest of support and builds a foundation for the next leg up.
The price has shown healthy consolidation just below ₹400, forming a base with stable volume. A sustained close above ₹400 could trigger a short-term reversal move toward ₹418 and ₹430 levels in the coming sessions.
📊 Study Highlights:
Weekly support confirmation at previous trendline
Neckline breakout with retest on daily chart
Gap fill adds confidence to structural strength
Consolidation phase ending near ₹400
Momentum recovery visible on short-term indicators
⚠️ Disclaimer:
This analysis is purely for educational and study purposes. Not a buy/sell recommendation. Always conduct your own due diligence.
For Study Purpose Only
🕒 Timeframe: Weekly & Daily
💡 Pattern: Cup & Handle (trendline retest + neckline breakout)
📈 Current Zone: ₹400–₹410
🎯 Targets: ₹418 / ₹430
⏳ Duration: 10–15 Days
🧭 Technical View:
On the weekly chart, Tata Power has taken support along the previous cup-and-handle trendline, right near the lower boundary of the handle, and has reversed upward from this level — suggesting a continuation of the larger bullish structure.
On the daily chart, the stock has delivered a clean neckline breakout while also filling the earlier runaway gap in the ₹400–₹410 zone. This gap fill acts as a successful retest of support and builds a foundation for the next leg up.
The price has shown healthy consolidation just below ₹400, forming a base with stable volume. A sustained close above ₹400 could trigger a short-term reversal move toward ₹418 and ₹430 levels in the coming sessions.
📊 Study Highlights:
Weekly support confirmation at previous trendline
Neckline breakout with retest on daily chart
Gap fill adds confidence to structural strength
Consolidation phase ending near ₹400
Momentum recovery visible on short-term indicators
⚠️ Disclaimer:
This analysis is purely for educational and study purposes. Not a buy/sell recommendation. Always conduct your own due diligence.
Wyłączenie odpowiedzialności
Informacje i publikacje nie stanowią i nie powinny być traktowane jako porady finansowe, inwestycyjne, tradingowe ani jakiekolwiek inne rekomendacje dostarczane lub zatwierdzone przez TradingView. Więcej informacji znajduje się w Warunkach użytkowania.
Wyłączenie odpowiedzialności
Informacje i publikacje nie stanowią i nie powinny być traktowane jako porady finansowe, inwestycyjne, tradingowe ani jakiekolwiek inne rekomendacje dostarczane lub zatwierdzone przez TradingView. Więcej informacji znajduje się w Warunkach użytkowania.