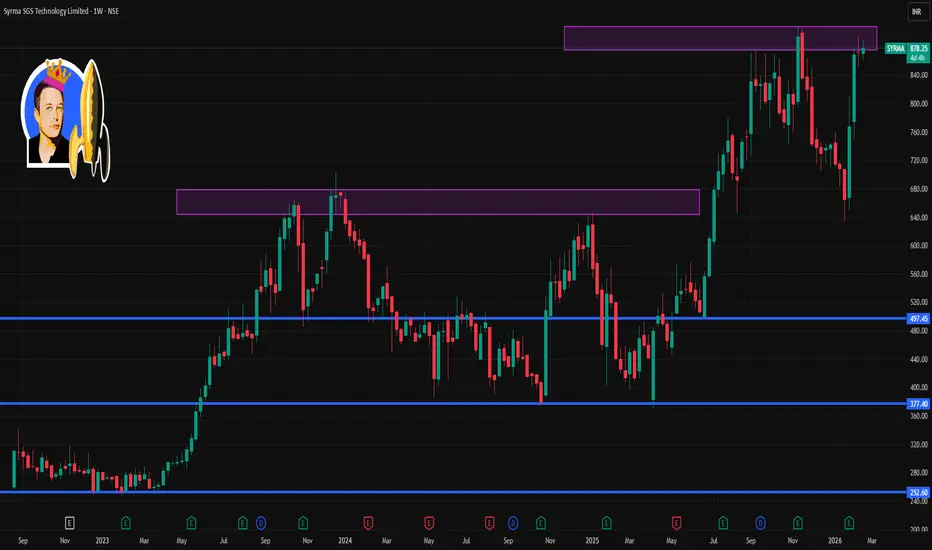
📌 Current Price: ~₹872–₹878 on NSE (recent trading range).
📈 Weekly Technical Levels (Support & Resistance)
🔹 Resistance Levels
R1: ~₹876 – immediate short-term upside hurdle (near recent high).
R2: ~₹892 – next resistance zone where selling pressure can appear.
R3: ~₹916 – bullish breakout target if price sustains above R2.
🔸 Pivot / Neutral Zone
Weekly Pivot ~₹849–₹873 area – this zone acts as reference for bullish vs bearish bias:
– Above pivot → bias turns mildly bullish
– Below pivot → bias is neutral/weak
🔻 Support Levels
S1: ~₹834 – first key support on weekly frame.
S2: ~₹806 – stronger downside support zone if S1 breaks.
S3: ~₹791 – deeper support level (next major cushion).
📊 These are the key weekly price barriers based on recent pivot and volume nodes — they help you gauge where buyers/sellers might step in over the next 5–7 days.
🧠 Short-Term Technical Context
Trend: Around range-bound to slightly bullish in the very short term — recent price is near weekly pivot/resistance area.
👉 Sustained break above ~₹892 would suggest momentum toward higher weekly levels (₹900+)
👉 Breakdown below ~₹806 could tilt short-term bias bearish.
Note: True weekly pivots adjust each trading week; the above is latest near-term reference based on technical sources.
Powiązane publikacje
Wyłączenie odpowiedzialności
Informacje i publikacje nie stanowią i nie powinny być traktowane jako porady finansowe, inwestycyjne, tradingowe ani jakiekolwiek inne rekomendacje dostarczane lub zatwierdzone przez TradingView. Więcej informacji znajduje się w Warunkach użytkowania.