### **Technical Analysis of Swiggy Ltd. (NSE)**
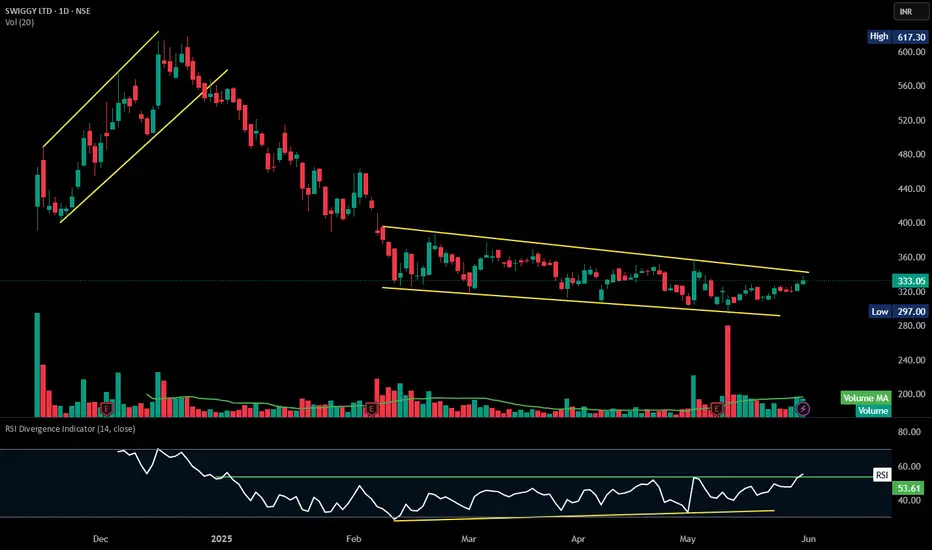
The chart highlights a **descending channel breakout**, indicating a potential trend reversal.
### **Key Observations:**
1. **Descending Channel Formation:**
- Price has oscillated within two downward-sloping trendlines from **January to June 2025**, creating a bearish trend.
- **Breakout above 333.05 INR** suggests buyers may be gaining control.
2. **Volume & Price Action:**
- **Current price:** **333.05 INR**, up **1.28% (+4.20 INR)**.
- **Volume (20-period moving average):** **19.7M vs. 21.35M**—watch for a sustained increase to confirm the breakout.
3. **RSI Divergence:**
- RSI is **55.23**, indicating improving momentum but not yet in overbought territory.
- Divergence suggests weakening bearish pressure, strengthening bullish reversal potential.
- **Support & Resistance:**
- **Support:** **297.00 INR**, the lower boundary of the previous range.
- **Resistance:** **352INR**, the prior high acting as an upside target.
Wyłączenie odpowiedzialności
Informacje i publikacje nie stanowią i nie powinny być traktowane jako porady finansowe, inwestycyjne, tradingowe ani jakiekolwiek inne rekomendacje dostarczane lub zatwierdzone przez TradingView. Więcej informacji znajduje się w Warunkach użytkowania.
Wyłączenie odpowiedzialności
Informacje i publikacje nie stanowią i nie powinny być traktowane jako porady finansowe, inwestycyjne, tradingowe ani jakiekolwiek inne rekomendacje dostarczane lub zatwierdzone przez TradingView. Więcej informacji znajduje się w Warunkach użytkowania.