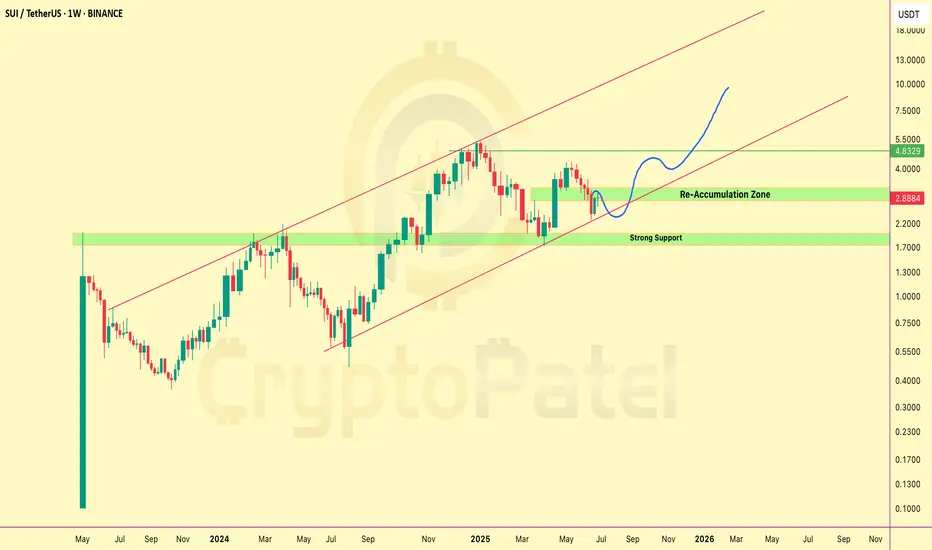
SUI is trading around $2.89, currently sitting in a key re-accumulation zone after a correction.
Trend: Still holding inside a long-term uptrend channel — structure remains bullish.
Support Zones:
🔹 $2.00–$2.50 is a strong demand area
🔹 $1.70 is a critical support — bullish above this,
but if price breaks below, we may enter major bearish mode
What to watch: If SUI holds this zone and continues upward:
🔹 Short-term target: $5/$10
🔹 Long-term potential: $20 → $50
I’m watching the $2.50 zone closely for possible long entries.
This could be a solid long-term opportunity if support holds.
NFA. DYOR.
Twitter: twitter.com/CryptoPatel
Telegram: t.me/OfficialCryptoPatel
Instagram: instagram.com/cryptopatel?utm_medium=copy_link
Telegram: t.me/OfficialCryptoPatel
Instagram: instagram.com/cryptopatel?utm_medium=copy_link
Wyłączenie odpowiedzialności
Informacje i publikacje przygotowane przez TradingView lub jego użytkowników, prezentowane na tej stronie, nie stanowią rekomendacji ani porad handlowych, inwestycyjnych i finansowych i nie powinny być w ten sposób traktowane ani wykorzystywane. Więcej informacji na ten temat znajdziesz w naszym Regulaminie.