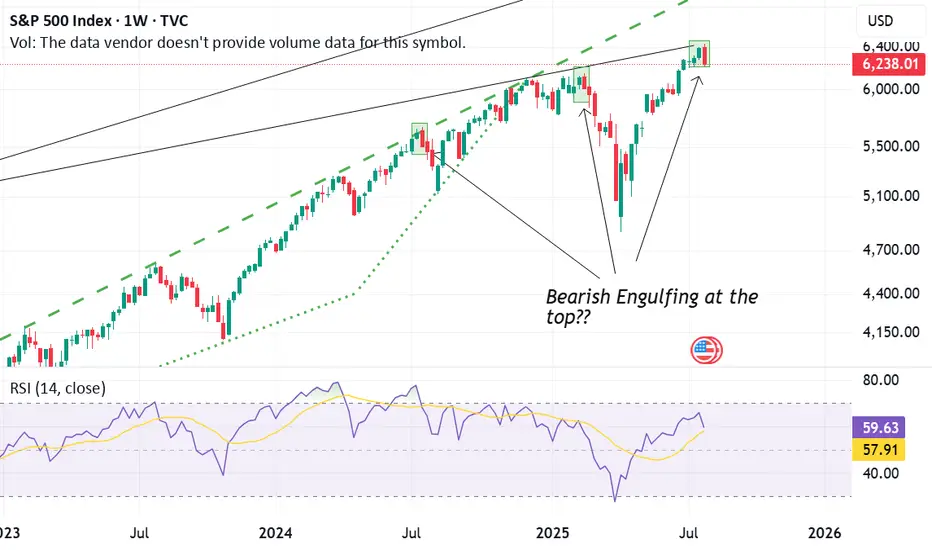
Last week, the S&P 500 Index (SPX) printed a bearish engulfing candle on the weekly chart. This candlestick pattern occurs when a larger red (bearish) candle completely "engulfs" the body of the previous green (bullish) candle. It is a classic reversal signal, often indicating that the momentum may be shifting from bullish to bearish.
What makes this significant is the recurring pattern we've observed:
At each of the last three market tops, the SPX formed a bearish engulfing pattern—and each time, this was followed by a notable correction or pullback.
The current candle mirrors those past setups almost identically, suggesting that the market may again be vulnerable to a short-term decline.
However, the big question remains:
"Will this time be different?"
In short, the bearish engulfing pattern is a warning sign—especially given its historical reliability at tops—but confirmation is key.
Ask ChatGPT
Uwaga
Confirmation did not come next week that negates the downside view...Apologies for the late updateWyłączenie odpowiedzialności
Informacje i publikacje przygotowane przez TradingView lub jego użytkowników, prezentowane na tej stronie, nie stanowią rekomendacji ani porad handlowych, inwestycyjnych i finansowych i nie powinny być w ten sposób traktowane ani wykorzystywane. Więcej informacji na ten temat znajdziesz w naszym Regulaminie.
Wyłączenie odpowiedzialności
Informacje i publikacje przygotowane przez TradingView lub jego użytkowników, prezentowane na tej stronie, nie stanowią rekomendacji ani porad handlowych, inwestycyjnych i finansowych i nie powinny być w ten sposób traktowane ani wykorzystywane. Więcej informacji na ten temat znajdziesz w naszym Regulaminie.