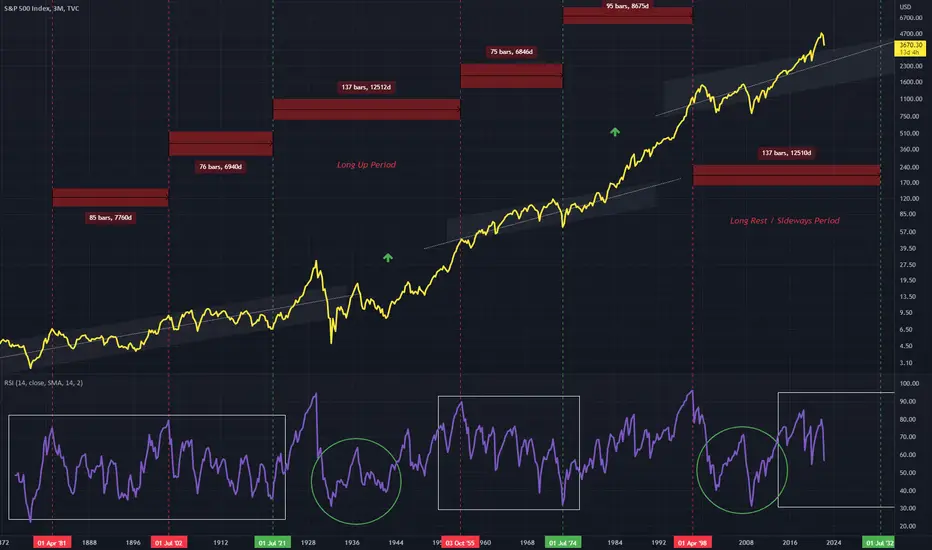
Two periods can be observed on the RSI for SPX on this 3Monthly chart
A downward trend which correlates with a sideways move on the relative timeframe
And a small uptrend that correlates with sharper growth on the SPX, these begin within the green circle
These green circles show very comparative structures, however one is during an up period, while the current one is during a sideways trend period
Price will very likely continue through the up channel on this larger timeframe
Wyłączenie odpowiedzialności
Informacje i publikacje przygotowane przez TradingView lub jego użytkowników, prezentowane na tej stronie, nie stanowią rekomendacji ani porad handlowych, inwestycyjnych i finansowych i nie powinny być w ten sposób traktowane ani wykorzystywane. Więcej informacji na ten temat znajdziesz w naszym Regulaminie.