SOL/USDT Weekly Chart Update
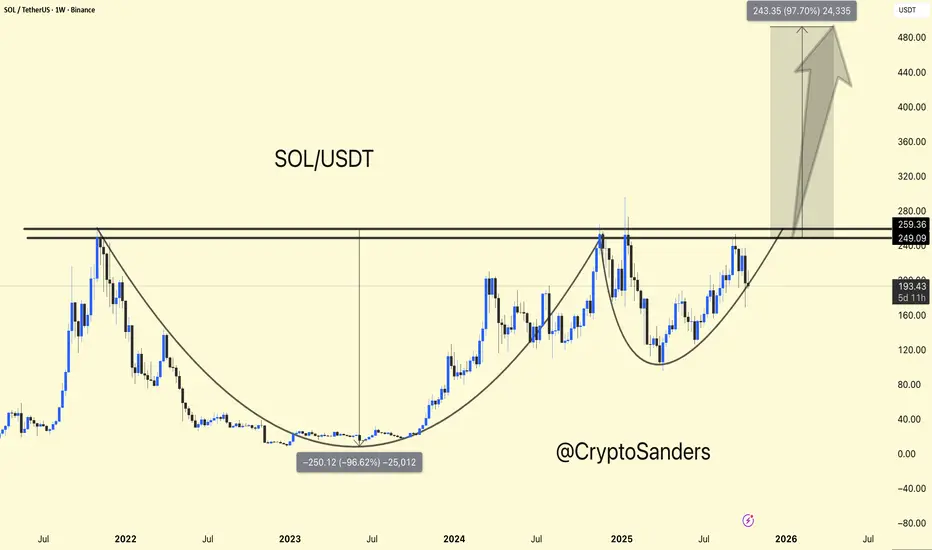
SOL is forming a massive cup and handle pattern on the weekly timeframe – a strong bullish continuation setup leading to a major breakout.
Currently trading around $199, SOL is consolidating below the key resistance level of $250-$260. Once we achieve a weekly close above $260, it could confirm a breakout move towards $450-$480 (approximately +90-100% upside).
Support: $170-$180 (handle base/accumulation zone)
Resistance: $250-$260 (breakout zone)
Target: $450-$480
Overall sentiment remains bullish – the structure is clear, and momentum is building. A confirmed breakout above the resistance level could mark the start of SOL's next major surge.
DYOR | NFA
Powiązane publikacje
Wyłączenie odpowiedzialności
Informacje i publikacje nie stanowią i nie powinny być traktowane jako porady finansowe, inwestycyjne, tradingowe ani jakiekolwiek inne rekomendacje dostarczane lub zatwierdzone przez TradingView. Więcej informacji znajduje się w Warunkach użytkowania.