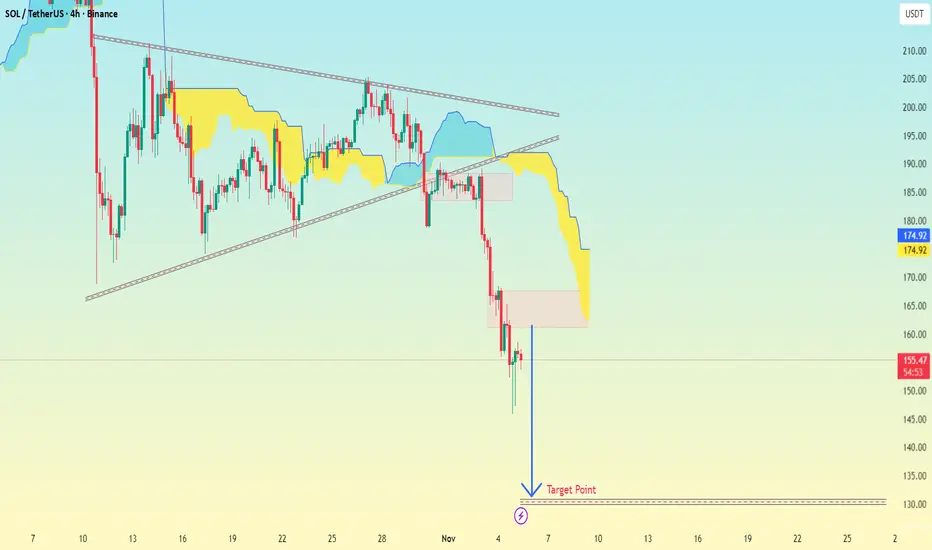
SOL/USDT (Solana vs Tether)
Timeframe: 4-hour chart
Exchange: Binance
Analysis tool: Ichimoku Cloud + trendlines
Pattern: my drawn a descending triangle or bearish pennant that recently broke downwards.
Current Price: Around $153.67
Target Point (marked): Around $135 – $137 zone
🎯 Target Zone
From my chart, the “Target Point” label is placed approximately at:
> $135 USDT
This aligns with a measured move projection from the height of the triangle (around $200 down to ~$160), giving a target near $135 — a typical price objective for a bearish breakout.
🧠 Quick Breakdown:
Price broke below support near $160.
The Ichimoku Cloud turned bearish (price below cloud, red span ahead).
Momentum and volume confirm downside continuation.
Target completion likely around $135 – $137, unless support appears earlier.
Zlecenie aktywne
active📲 Join telegram channel free .
t.me/addlist/dg3uSwzkMSplNjFk
Forex, Gold & Crypto Signals with detailed analysis & get consistent results.
t.me/addlist/dg3uSwzkMSplNjFk
Gold Signal's with proper TP & SL for high profit opportunities.
t.me/addlist/dg3uSwzkMSplNjFk
Forex, Gold & Crypto Signals with detailed analysis & get consistent results.
t.me/addlist/dg3uSwzkMSplNjFk
Gold Signal's with proper TP & SL for high profit opportunities.
Powiązane publikacje
Wyłączenie odpowiedzialności
Informacje i publikacje przygotowane przez TradingView lub jego użytkowników, prezentowane na tej stronie, nie stanowią rekomendacji ani porad handlowych, inwestycyjnych i finansowych i nie powinny być w ten sposób traktowane ani wykorzystywane. Więcej informacji na ten temat znajdziesz w naszym Regulaminie.
📲 Join telegram channel free .
t.me/addlist/dg3uSwzkMSplNjFk
Forex, Gold & Crypto Signals with detailed analysis & get consistent results.
t.me/addlist/dg3uSwzkMSplNjFk
Gold Signal's with proper TP & SL for high profit opportunities.
t.me/addlist/dg3uSwzkMSplNjFk
Forex, Gold & Crypto Signals with detailed analysis & get consistent results.
t.me/addlist/dg3uSwzkMSplNjFk
Gold Signal's with proper TP & SL for high profit opportunities.
Powiązane publikacje
Wyłączenie odpowiedzialności
Informacje i publikacje przygotowane przez TradingView lub jego użytkowników, prezentowane na tej stronie, nie stanowią rekomendacji ani porad handlowych, inwestycyjnych i finansowych i nie powinny być w ten sposób traktowane ani wykorzystywane. Więcej informacji na ten temat znajdziesz w naszym Regulaminie.