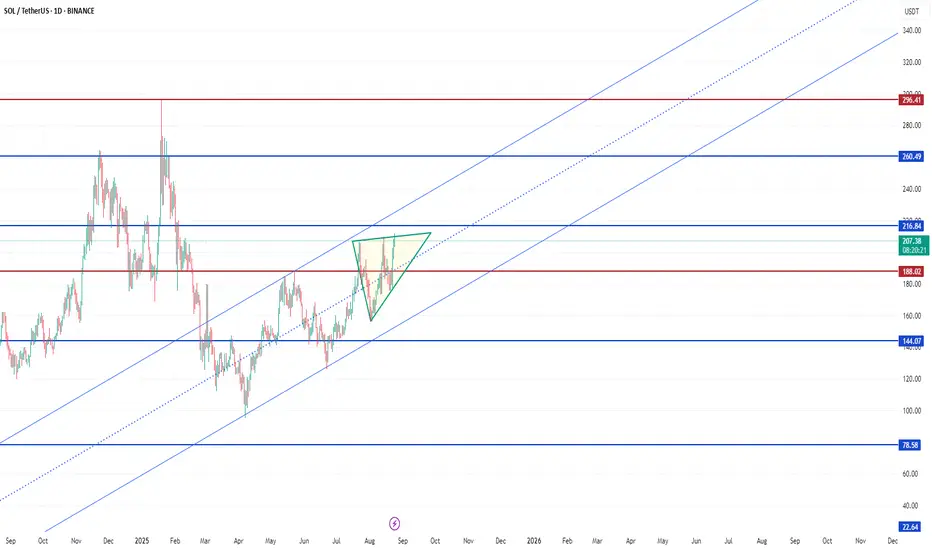
The bar chart is in a mid-upward trend, having started in April 2025 and continued up to the present. Now, the chart is trapped in a triangle for a month. The future trend of the chart depends on the following break. If it can break above the triangle, and respectively exceed the resistance level, at $217, it would increase by $216 in the mid term.
On the other hand, the opposite scenario is a break below. In other words, the price might reduce to $144 if it breaks the support level, at $188, it is a crucial level because of the juncture of the bottom of the triangle, and $188 support level.
To sum up, there are two ways, an increase or a decrease, for SOLANA, and it generally depends on the first break will occur up or down.
Wyłączenie odpowiedzialności
Informacje i publikacje nie stanowią i nie powinny być traktowane jako porady finansowe, inwestycyjne, tradingowe ani jakiekolwiek inne rekomendacje dostarczane lub zatwierdzone przez TradingView. Więcej informacji znajduje się w Warunkach użytkowania.
Wyłączenie odpowiedzialności
Informacje i publikacje nie stanowią i nie powinny być traktowane jako porady finansowe, inwestycyjne, tradingowe ani jakiekolwiek inne rekomendacje dostarczane lub zatwierdzone przez TradingView. Więcej informacji znajduje się w Warunkach użytkowania.