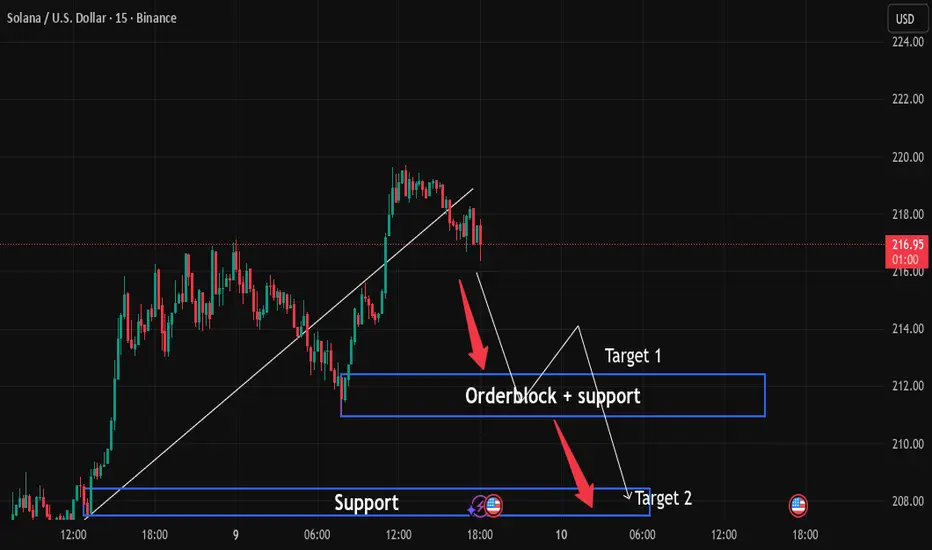
The recent price action shows that SOL has made a strong upward move, marking a significant higher high. However, we’re now observing the early signs of a pullback after the bullish momentum weakened near the $218 resistance level.
Notice the steep trendline that supported the previous bullish run—it has now been broken, signaling a possible change in market structure. The momentum appears to be shifting from bullish to neutral or even slightly bearish in the very short term.
🟦 Key Zones Highlighted:
Orderblock + Support Zone (Around $214.8–$215.5):
This area represents a previous consolidation before the last impulsive bullish move.
Often, these orderblocks act as strong zones of interest where institutions may re-enter the market.
It also aligns with a horizontal support level, increasing the probability of a short-term bounce if price revisits this level.
This is marked as Target 1—a potential take-profit level for short sellers or an entry point for bounce traders.
Deeper Support Zone (Below $212, around $210–$211):
This is the last major support that held before the price took off in the earlier session.
Marked as Target 2, this is where price may head if the current support breaks down.
This level will be crucial for bulls to defend if SOLUSD is to maintain its overall bullish structure on higher timeframes.
🔻 Bearish Outlook (Short-Term):
Given the breakdown of the trendline and the sharp rejection from the highs, we may be seeing the beginning of a correctional phase. The confluence of signals points toward a possible liquidity grab or orderblock mitigation, which could see price revisit the identified zones before deciding the next directional move.
If the price holds above the orderblock and prints a bullish structure, we could see a bounce back to the $218–$220 level. However, if it breaks below the support zone at Target 2, it could open the gates toward sub-$210 levels, offering short sellers further opportunities.
🧠 What Traders Should Watch For:
Price Reaction at Orderblock (Target 1):
Look for bullish candlestick patterns like bullish engulfing, hammer, or a reversal structure on the 5m/15m.
Volume Spike:
Increased volume near the support zone could hint at institutional buying or panic selling.
Failing to Hold Target 2:
A close below Target 2 could invalidate the bullish bias in the short term and confirm bearish continuation.
⚠️ Disclaimer: This is not financial advice. Always conduct your own research and risk management. The analysis is based on historical price action and technical patterns which may not guarantee future results.
For Educational Purpose And Free Signal Join telegram
t.me/HamzaGoldTrades
t.me/HamzaGoldTrades
Wyłączenie odpowiedzialności
Informacje i publikacje przygotowane przez TradingView lub jego użytkowników, prezentowane na tej stronie, nie stanowią rekomendacji ani porad handlowych, inwestycyjnych i finansowych i nie powinny być w ten sposób traktowane ani wykorzystywane. Więcej informacji na ten temat znajdziesz w naszym Regulaminie.