Overview Context:
Support: $190.00
Resistance: $260.00
Supply Area: $245 to $260
Demand Area: $200 to $215
Psychological Levels: $270 and ATH ($300 Area)
Technical Context:
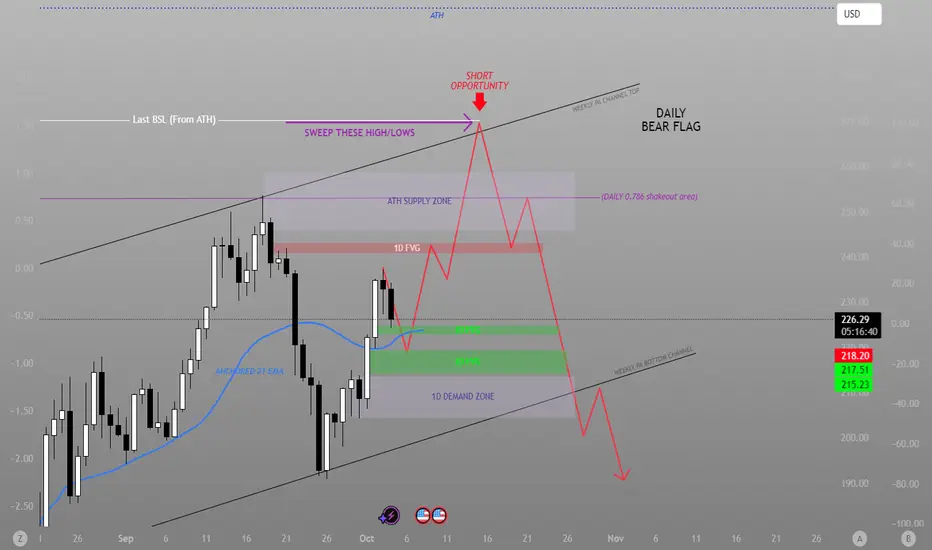
Technical Structure- We are still residing in our Weekly PA channel that began in April of 2025. With Solana showing strong bullish momentum we see a recipie for a new ATH or a huge reversal at the most prominent price points.
Volume Context:
Volume Insight suggest that a massive amount of liquidity on the Weekly Timeframe is all the way down to the $22 range. While the Daily Timeframe shows a concentration around our Demand Zone.
Extra Confluences (DAILY TF):
FVG -
One bullish Daily FVG located below price. One smaller bearish Daily FVG above price.
Golden Pocket-
The Golden pocket has been met but we see the 0.786 level possibly getting retested.
EMA-
The Daily Timeframe 21 EMA is below price showing storng bullish momentum
RSI-
A bullish signal line crossover is present at the midline to most likely revisit the Overbought region.
MACD-
We are approching a crossover of the midline with extreme bullish momentum. A strong confluence for rally.
Bearish Scenario:
We find ourselves slowly rejecting off of the 50% area of our weekly PA channel and off of the Daily 21EMA. We retrace down to and tap into the Daily FVG located just below price and we get a bounce to the 0.786 level of the ATH to shake retail once more before we change momentum and see a massive reversal as we clear the Supply Zone created by the ATH to sweep the final Buy Side Liquidity pocket and implement a false breakout of our PA channel for a short opportunity.
Support: $190.00
Resistance: $260.00
Supply Area: $245 to $260
Demand Area: $200 to $215
Psychological Levels: $270 and ATH ($300 Area)
Technical Context:
Technical Structure- We are still residing in our Weekly PA channel that began in April of 2025. With Solana showing strong bullish momentum we see a recipie for a new ATH or a huge reversal at the most prominent price points.
Volume Context:
Volume Insight suggest that a massive amount of liquidity on the Weekly Timeframe is all the way down to the $22 range. While the Daily Timeframe shows a concentration around our Demand Zone.
Extra Confluences (DAILY TF):
FVG -
One bullish Daily FVG located below price. One smaller bearish Daily FVG above price.
Golden Pocket-
The Golden pocket has been met but we see the 0.786 level possibly getting retested.
EMA-
The Daily Timeframe 21 EMA is below price showing storng bullish momentum
RSI-
A bullish signal line crossover is present at the midline to most likely revisit the Overbought region.
MACD-
We are approching a crossover of the midline with extreme bullish momentum. A strong confluence for rally.
Bearish Scenario:
We find ourselves slowly rejecting off of the 50% area of our weekly PA channel and off of the Daily 21EMA. We retrace down to and tap into the Daily FVG located just below price and we get a bounce to the 0.786 level of the ATH to shake retail once more before we change momentum and see a massive reversal as we clear the Supply Zone created by the ATH to sweep the final Buy Side Liquidity pocket and implement a false breakout of our PA channel for a short opportunity.
Wyłączenie odpowiedzialności
Informacje i publikacje przygotowane przez TradingView lub jego użytkowników, prezentowane na tej stronie, nie stanowią rekomendacji ani porad handlowych, inwestycyjnych i finansowych i nie powinny być w ten sposób traktowane ani wykorzystywane. Więcej informacji na ten temat znajdziesz w naszym Regulaminie.