Bulls Eye $30 as Gamma Pressure Builds 🚀
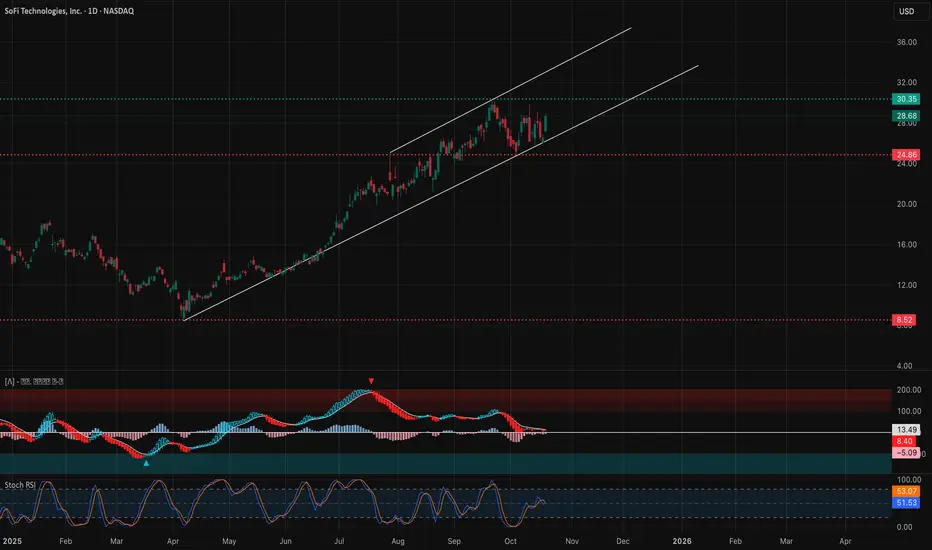
📆 Daily Chart — Macro Structure and Bias
Market Structure: SOFI continues to respect its long-term ascending channel that’s been intact since the May reversal. The most recent correction held firmly at $24.80, forming a clean higher low — classic accumulation behavior from institutional players. We’ve now seen a Break of Structure (BOS) above $28.50, confirming a potential continuation leg within the channel.
The daily candles show price regaining control above both EMAs and compressing just below the mid-channel resistance. That tells me bulls are gradually reloading after shaking out weak hands during the $25–$26 liquidity sweep.
Supply & Demand / Order Blocks:
* Major Demand Zone: $24.50–$25.00 (base of the previous bullish order block and channel support).
* Current Support: $27.80–$28.50 (recent OB retest).
* Supply Zone: $30.35–$31.00 (channel resistance and prior August high).
A breakout daily close above $30.35 would create a macro BOS and open potential upside to $32–$33, where the next liquidity pool sits.
Indicator Confluence:
* 9 EMA vs 21 EMA: Bullish crossover with the 9 EMA starting to curl upward.
* MACD: Histogram turning positive after extended red fade — early momentum shift.
* Stoch RSI: Rising from mid-range (50–60) toward 70, suggesting energy building before another push.
* Volume: Gradually increasing on up days, consistent with healthy accumulation.
The daily structure favors bullish continuation if $28.50 continues to hold as the higher low pivot.
⏱️ 1-Hour Chart — Short-Term Trend and Key Swing Zones

Market Structure: After multiple CHoCH signals from the descending structure last week, SOFI confirmed a clean BOS at $27.20, breaking out from its falling wedge. The 1-hour structure has now transitioned decisively bullish, forming higher highs and defending higher lows.
Price action is currently consolidating above $28.60–$28.90, which also aligns with the 1-hour 9 EMA — acting as dynamic support. The next leg higher targets the $29.80–$30.40 region, where prior liquidity and the upper gamma wall converge.
Supply & Demand / OB Zones:
* Demand: $26.50 (prior CHoCH base).
* Fresh OB: $28.40–$28.60 (new accumulation block).
* Supply: $29.80–$30.35 (liquidity & resistance cluster).
Indicator Confluence:
* 9 EMA > 21 EMA with widening gap — healthy bullish momentum.
* MACD: Strong positive crossover, expanding histogram showing trend strength.
* Stoch RSI: Hovering above 80, suggesting extended strength but near short-term overbought; pullbacks to EMA likely get bought.
* Volume: Expansion during up candles → confirms conviction, not just low-liquidity drift.
Trade Scenarios:
* Bullish Setup: Enter near $28.50–$28.70 → Target $29.80 / $30.35 → Stop $27.40.
* Bearish Setup: If rejection at $30.35 with divergence → Target $28.80 / $27.80 → Stop above $30.60.
I’ll be watching how the 1-hour candle behaves at $30 — a clean break could start a new expansion cycle.
🕒 15-Minute Chart — Intraday Momentum and Scalping Zones

Market Structure: SOFI’s 15-minute chart shows tight consolidation after a strong CHoCH and BOS confirmation above $27.00. Each dip into $28.40 has been defended with increasing volume — the hallmark of intraday accumulation. Liquidity sweeps beneath the minor intraday OBs have triggered fast reversals, suggesting strong algo buying activity.
Supply & Demand / OB Levels:
* Demand Zone: $28.40–$28.60 (micro OB from previous breakout).
* Supply Zone: $29.00–$29.40 (short-term resistance and liquidity pocket).
Indicator Confluence:
* 9 EMA vs 21 EMA: Bullish alignment, both rising steeply.
* MACD: Momentum expanding upward with consistent histogram growth.
* Stoch RSI: Cycling around 70–85 — bullish but nearing short-term exhaustion.
* Volume: High-volume nodes appear on breakouts, confirming real participation.
Scalp Plan:
* Bullish Bias: Buy dips near $28.40 → Target $29.10 → $29.50 → $30.00 → Stop below $27.90.
* Bearish Bias: If $29.80 rejects twice → Scalp short to $28.80 → Stop $30.20.
The intraday bias stays bullish as long as we’re above $28.40; below that, momentum cools into a neutral range.
📊 GEX (Gamma Exposure) & Options Sentiment Overview

SOFI’s options positioning supports the bullish technical picture. Dealers are increasingly exposed to positive gamma near $29–$30, effectively pinning price in this range as hedging flows compress volatility.
Key GEX Levels:
* Highest Positive Gamma: $29.80–$30.00 (dealer magnet zone).
* Major Call Walls: $29.00 and $30.00 (likely short-term tops).
* Put Support: $26.50 (first defensive wall) and $25.00 (deep gamma cushion).
* IVR: 45.7 — moderate, indicating balanced option pricing.
* Call Flow: 59.8% of all volume favors calls, consistent with institutional hedging toward the upside.
If SOFI can break and hold above $30.35, we could see a gamma expansion — a short-term squeeze triggered by dealers buying to hedge rising delta exposure. Conversely, rejection below $30 may cause temporary reversion to $27–$26.5 before reaccumulation.
🎯 Closing Outlook
The broader setup across all timeframes points bullish into the week of October 21–25. SOFI is steadily regaining strength within its long-term uptrend, and the gamma positioning supports further expansion toward the $30 zone.
As long as $28.40–$28.60 holds, dips are opportunities — not breakdowns. If bulls clear $30.35 with conviction, it could spark the next leg into $32+.
I’m watching closely for a liquidity trap around $29.80–$30.20. If bulls absorb that region and hold, it’s game on for a gamma-fueled continuation.
Disclaimer: This analysis is for educational purposes only and not financial advice. Always do your own research and manage your risk.
📆 Daily Chart — Macro Structure and Bias
Market Structure: SOFI continues to respect its long-term ascending channel that’s been intact since the May reversal. The most recent correction held firmly at $24.80, forming a clean higher low — classic accumulation behavior from institutional players. We’ve now seen a Break of Structure (BOS) above $28.50, confirming a potential continuation leg within the channel.
The daily candles show price regaining control above both EMAs and compressing just below the mid-channel resistance. That tells me bulls are gradually reloading after shaking out weak hands during the $25–$26 liquidity sweep.
Supply & Demand / Order Blocks:
* Major Demand Zone: $24.50–$25.00 (base of the previous bullish order block and channel support).
* Current Support: $27.80–$28.50 (recent OB retest).
* Supply Zone: $30.35–$31.00 (channel resistance and prior August high).
A breakout daily close above $30.35 would create a macro BOS and open potential upside to $32–$33, where the next liquidity pool sits.
Indicator Confluence:
* 9 EMA vs 21 EMA: Bullish crossover with the 9 EMA starting to curl upward.
* MACD: Histogram turning positive after extended red fade — early momentum shift.
* Stoch RSI: Rising from mid-range (50–60) toward 70, suggesting energy building before another push.
* Volume: Gradually increasing on up days, consistent with healthy accumulation.
The daily structure favors bullish continuation if $28.50 continues to hold as the higher low pivot.
⏱️ 1-Hour Chart — Short-Term Trend and Key Swing Zones
Market Structure: After multiple CHoCH signals from the descending structure last week, SOFI confirmed a clean BOS at $27.20, breaking out from its falling wedge. The 1-hour structure has now transitioned decisively bullish, forming higher highs and defending higher lows.
Price action is currently consolidating above $28.60–$28.90, which also aligns with the 1-hour 9 EMA — acting as dynamic support. The next leg higher targets the $29.80–$30.40 region, where prior liquidity and the upper gamma wall converge.
Supply & Demand / OB Zones:
* Demand: $26.50 (prior CHoCH base).
* Fresh OB: $28.40–$28.60 (new accumulation block).
* Supply: $29.80–$30.35 (liquidity & resistance cluster).
Indicator Confluence:
* 9 EMA > 21 EMA with widening gap — healthy bullish momentum.
* MACD: Strong positive crossover, expanding histogram showing trend strength.
* Stoch RSI: Hovering above 80, suggesting extended strength but near short-term overbought; pullbacks to EMA likely get bought.
* Volume: Expansion during up candles → confirms conviction, not just low-liquidity drift.
Trade Scenarios:
* Bullish Setup: Enter near $28.50–$28.70 → Target $29.80 / $30.35 → Stop $27.40.
* Bearish Setup: If rejection at $30.35 with divergence → Target $28.80 / $27.80 → Stop above $30.60.
I’ll be watching how the 1-hour candle behaves at $30 — a clean break could start a new expansion cycle.
🕒 15-Minute Chart — Intraday Momentum and Scalping Zones
Market Structure: SOFI’s 15-minute chart shows tight consolidation after a strong CHoCH and BOS confirmation above $27.00. Each dip into $28.40 has been defended with increasing volume — the hallmark of intraday accumulation. Liquidity sweeps beneath the minor intraday OBs have triggered fast reversals, suggesting strong algo buying activity.
Supply & Demand / OB Levels:
* Demand Zone: $28.40–$28.60 (micro OB from previous breakout).
* Supply Zone: $29.00–$29.40 (short-term resistance and liquidity pocket).
Indicator Confluence:
* 9 EMA vs 21 EMA: Bullish alignment, both rising steeply.
* MACD: Momentum expanding upward with consistent histogram growth.
* Stoch RSI: Cycling around 70–85 — bullish but nearing short-term exhaustion.
* Volume: High-volume nodes appear on breakouts, confirming real participation.
Scalp Plan:
* Bullish Bias: Buy dips near $28.40 → Target $29.10 → $29.50 → $30.00 → Stop below $27.90.
* Bearish Bias: If $29.80 rejects twice → Scalp short to $28.80 → Stop $30.20.
The intraday bias stays bullish as long as we’re above $28.40; below that, momentum cools into a neutral range.
📊 GEX (Gamma Exposure) & Options Sentiment Overview
SOFI’s options positioning supports the bullish technical picture. Dealers are increasingly exposed to positive gamma near $29–$30, effectively pinning price in this range as hedging flows compress volatility.
Key GEX Levels:
* Highest Positive Gamma: $29.80–$30.00 (dealer magnet zone).
* Major Call Walls: $29.00 and $30.00 (likely short-term tops).
* Put Support: $26.50 (first defensive wall) and $25.00 (deep gamma cushion).
* IVR: 45.7 — moderate, indicating balanced option pricing.
* Call Flow: 59.8% of all volume favors calls, consistent with institutional hedging toward the upside.
If SOFI can break and hold above $30.35, we could see a gamma expansion — a short-term squeeze triggered by dealers buying to hedge rising delta exposure. Conversely, rejection below $30 may cause temporary reversion to $27–$26.5 before reaccumulation.
🎯 Closing Outlook
The broader setup across all timeframes points bullish into the week of October 21–25. SOFI is steadily regaining strength within its long-term uptrend, and the gamma positioning supports further expansion toward the $30 zone.
As long as $28.40–$28.60 holds, dips are opportunities — not breakdowns. If bulls clear $30.35 with conviction, it could spark the next leg into $32+.
I’m watching closely for a liquidity trap around $29.80–$30.20. If bulls absorb that region and hold, it’s game on for a gamma-fueled continuation.
Disclaimer: This analysis is for educational purposes only and not financial advice. Always do your own research and manage your risk.
Wyłączenie odpowiedzialności
Informacje i publikacje przygotowane przez TradingView lub jego użytkowników, prezentowane na tej stronie, nie stanowią rekomendacji ani porad handlowych, inwestycyjnych i finansowych i nie powinny być w ten sposób traktowane ani wykorzystywane. Więcej informacji na ten temat znajdziesz w naszym Regulaminie.