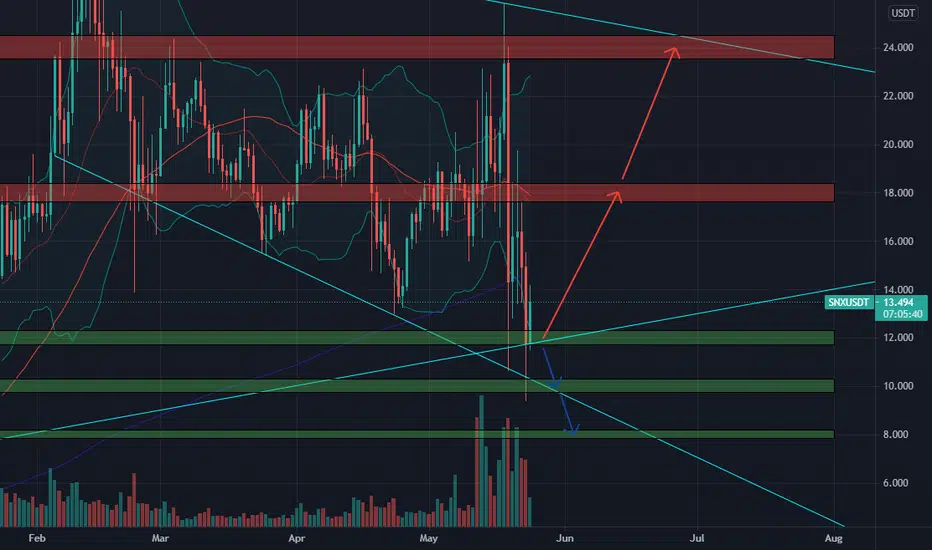
SNX is recovering from the 12$ zone, and is heading to 18$ and 24$ zone in June. But if it loses this 12$ zone again, it will have a big fall to 10$ or 8$ in early June
📈BUY
-Buy: 11.7-12.3$. SL if B
📉SELL
-Sell: 17.6-18.4$. SL if A
-Sell: 23.5-24.5$. SL if A
♻️BACK-UP
-Sell: 11.7-12.3$ if B. SL if A
-Buy: 9.7-10.3$ if A. SL if B
-Buy: 7.8-8.2$ if A. SL if B
❓Details
🕯Timeframe : 1 Day
📈Red Arrow : Main Direction as BUY and SELL section
📉Blue Arrow : Back-Up Direction as BACK-UP section
🟩Green zone : Support zone as BUY section
🟥Red zone : Resistance zone as SELL section
🅰️A : The Close price of candlestick is Above the zone
🅱️B : The Close price of candlestick is Below the zone
Wyłączenie odpowiedzialności
Informacje i publikacje przygotowane przez TradingView lub jego użytkowników, prezentowane na tej stronie, nie stanowią rekomendacji ani porad handlowych, inwestycyjnych i finansowych i nie powinny być w ten sposób traktowane ani wykorzystywane. Więcej informacji na ten temat znajdziesz w naszym Regulaminie.