- this is an idea about how to prepare a view on various stocks of an index , based on the index price-action analysis ,
- here we have a bearish view on the SIXB index , based on the behaviour of price-action of
recent candles ( 3h) . 3H is taken for having lesser clutter on charts and also have smaller time ( lesser than 1D candle ) frame view .
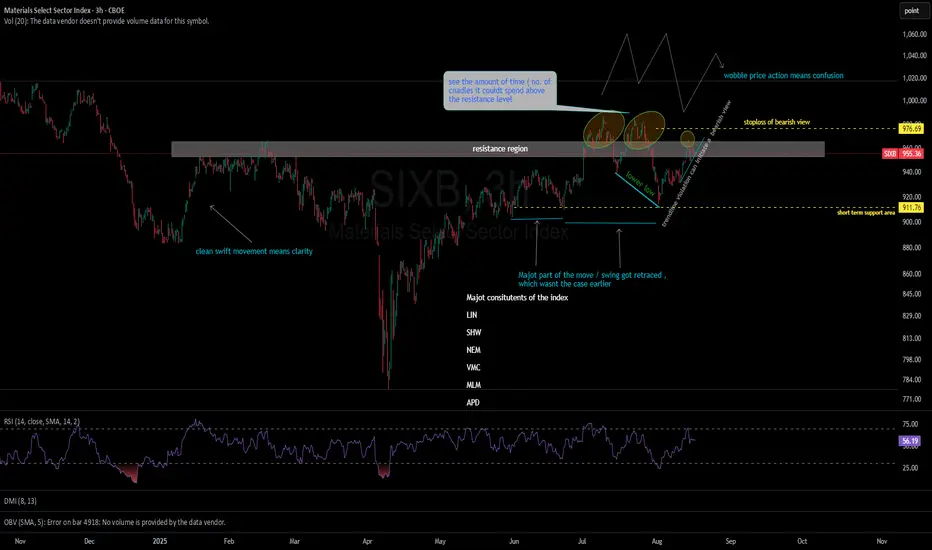
there is a strong resistance level visible, which has created a selling pressure twice , which created two lower lows .
and as the prices reached this resistance level , it started wobbling up-down , which shows the confusion and two forces acting on the prices ( bull and bears ). ( when the market moves swift and clean , it shows majority of the market players are in agreement of same direction )
here the prices are the resistance level as already seen , and now to take a trade here in the index or index constituents , we need a confirmation of breach of trendline, and prices plotting lower highs and lower lows .
the trade target becomes the first recent support level or cluster of supports ( dotted yellow line ) approx. 4% target
invalidation of this view , or stop loss is also market few pips above the recent top ( which is weaker top ) approx. 2% stop loss
risk to reward : 1 :2
further breaking down the analysis for the bearish view is :
observe the number of candles prices could sustain above the resistance level , very few .. and every time it managed to breach the resistance level it created a LOWER LOW .. which is much much significant thing to note.
and if the trendline is breached now , we can expect a newer lower low which comes to beyond the current cluster of supports as well .
based on this view on the index , one needs to check for the confluence in the major constituents of the same index being discussed . if you find the confluence between the index and the constituent , go on with the trade ...
and if you don't find the confluence then that scrip becomes the candidate for further investigation which is beyond technical analysis ( like financial , fundamental analysis )
Major constituents of the index
this is just a tutorial for analysing price action , without much use of indicators , for basic starter traders . joining 2-3 blocks of such analysis gives a more robust picture ( some price action , some indicators , and some stock comparison )
hope this helps !
Wyłączenie odpowiedzialności
Informacje i publikacje przygotowane przez TradingView lub jego użytkowników, prezentowane na tej stronie, nie stanowią rekomendacji ani porad handlowych, inwestycyjnych i finansowych i nie powinny być w ten sposób traktowane ani wykorzystywane. Więcej informacji na ten temat znajdziesz w naszym Regulaminie.