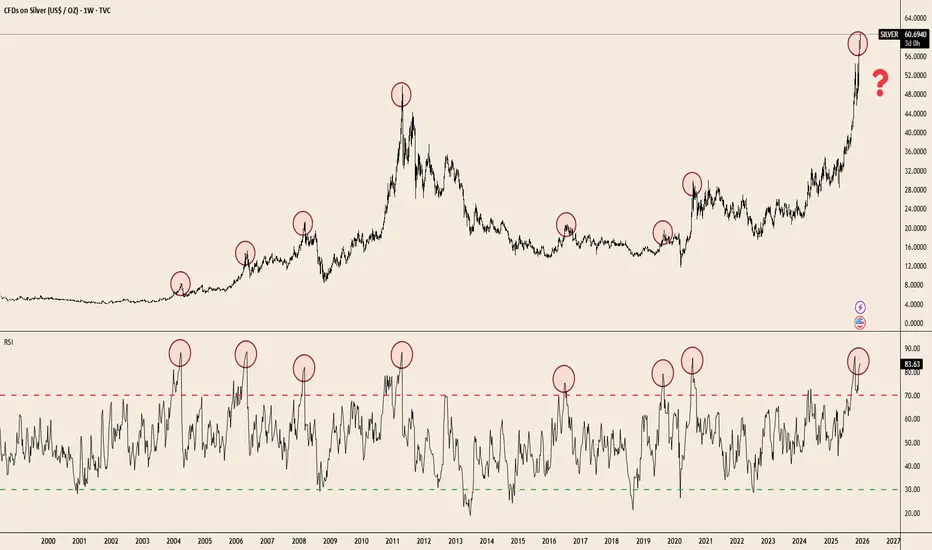
The chart makes the pattern clear:
• Each parabolic advance since 2004 ended with RSI extremes similar to today.
• Price is testing the same overextension zone seen at the 2011 blow-off top and the 2020 surge.
• Weekly RSI rarely stays above 80 for long — momentum tends to reset before the next leg can form.
This doesn’t guarantee a top.
But when a commodity doubles in a single year and hits long-term RSI ceilings simultaneously, risk/reward becomes asymmetric.
Silver’s trend remains powerful — the question now is how sustainable the slope is.
Wyłączenie odpowiedzialności
Informacje i publikacje nie stanowią i nie powinny być traktowane jako porady finansowe, inwestycyjne, tradingowe ani jakiekolwiek inne rekomendacje dostarczane lub zatwierdzone przez TradingView. Więcej informacji znajduje się w Warunkach użytkowania.
Wyłączenie odpowiedzialności
Informacje i publikacje nie stanowią i nie powinny być traktowane jako porady finansowe, inwestycyjne, tradingowe ani jakiekolwiek inne rekomendacje dostarczane lub zatwierdzone przez TradingView. Więcej informacji znajduje się w Warunkach użytkowania.