Fundamentals
Market cap approx ~ ₹10,200 Cr.
Revenue ~ ₹5,408 Cr and Profit ~ ₹906 Cr.
5-year sales growth modest at ~4.8%.
Return on Equity (ROE) ~ ~10% over recent years.
Contingent liabilities are high (~₹4,300 Cr).
Debt/equity relatively moderate (≈0.33×) per one source.
Valuation: P/E around ~11-14× in some reports.
Key takeaway: SCI has stable business size, moderate returns. But growth is slow and there are risks (high contingent liabilities, moderate ROE). Valuation is reasonable to slightly discounted in some view, but not ultra-cheap given growth constraints.
📈 Technical / Positional Setup
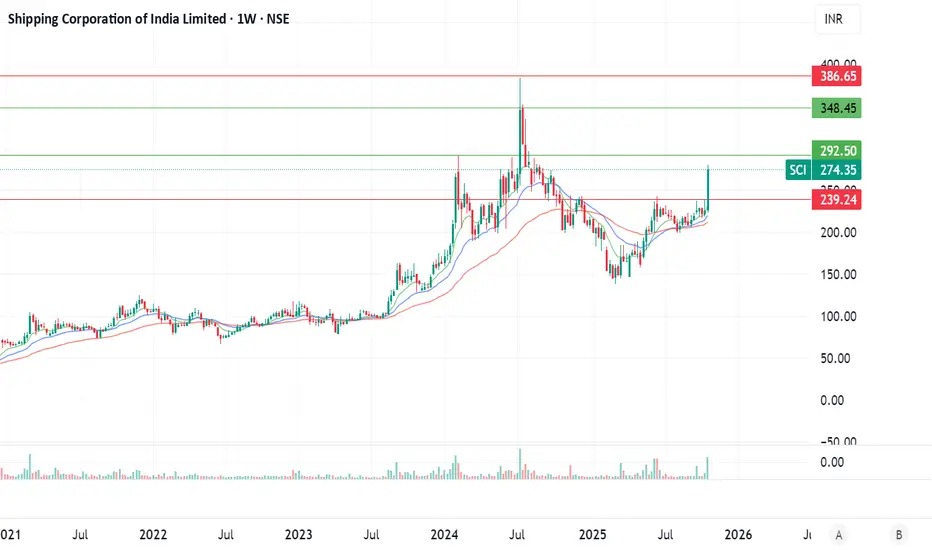
Based on the weekly chart you shared:
Price recently had a strong weekly move upward, clearing what appears to be a breakout above prior resistance (~ ₹240-₹250 zone).
Support zone appears around ~ ₹230-₹240 (previous consolidation and EMA zones).
Next resistance appears near ~ ₹290-₹300 region (based on old highs).
Trend seems to be turning bullish, provided price holds above breakout level and volume supports.
Trade Plan:
Parameter Suggested Level / Zone
Entry On sustained closing above ~ ₹270-₹280 with volume confirmation
Stop-Loss Below ~ ₹230-₹240 (support zone)
Target 1 ~ ₹310-₹330
Target 2 ~ ₹350+ (if momentum strong)
If the price pulls back to the breakout zone (~₹240-₹250) and holds, that could be a safer entry point.
Watch volume: a strong breakout with high volume increases reliability.
Because fundamentals are moderate (growth slow), this is more of a tactical / positional trade rather than a long-term growth play.
Market cap approx ~ ₹10,200 Cr.
Revenue ~ ₹5,408 Cr and Profit ~ ₹906 Cr.
5-year sales growth modest at ~4.8%.
Return on Equity (ROE) ~ ~10% over recent years.
Contingent liabilities are high (~₹4,300 Cr).
Debt/equity relatively moderate (≈0.33×) per one source.
Valuation: P/E around ~11-14× in some reports.
Key takeaway: SCI has stable business size, moderate returns. But growth is slow and there are risks (high contingent liabilities, moderate ROE). Valuation is reasonable to slightly discounted in some view, but not ultra-cheap given growth constraints.
📈 Technical / Positional Setup
Based on the weekly chart you shared:
Price recently had a strong weekly move upward, clearing what appears to be a breakout above prior resistance (~ ₹240-₹250 zone).
Support zone appears around ~ ₹230-₹240 (previous consolidation and EMA zones).
Next resistance appears near ~ ₹290-₹300 region (based on old highs).
Trend seems to be turning bullish, provided price holds above breakout level and volume supports.
Trade Plan:
Parameter Suggested Level / Zone
Entry On sustained closing above ~ ₹270-₹280 with volume confirmation
Stop-Loss Below ~ ₹230-₹240 (support zone)
Target 1 ~ ₹310-₹330
Target 2 ~ ₹350+ (if momentum strong)
If the price pulls back to the breakout zone (~₹240-₹250) and holds, that could be a safer entry point.
Watch volume: a strong breakout with high volume increases reliability.
Because fundamentals are moderate (growth slow), this is more of a tactical / positional trade rather than a long-term growth play.
Wyłączenie odpowiedzialności
Informacje i publikacje nie stanowią i nie powinny być traktowane jako porady finansowe, inwestycyjne, tradingowe ani jakiekolwiek inne rekomendacje dostarczane lub zatwierdzone przez TradingView. Więcej informacji znajduje się w Warunkach użytkowania.
Wyłączenie odpowiedzialności
Informacje i publikacje nie stanowią i nie powinny być traktowane jako porady finansowe, inwestycyjne, tradingowe ani jakiekolwiek inne rekomendacje dostarczane lub zatwierdzone przez TradingView. Więcej informacji znajduje się w Warunkach użytkowania.