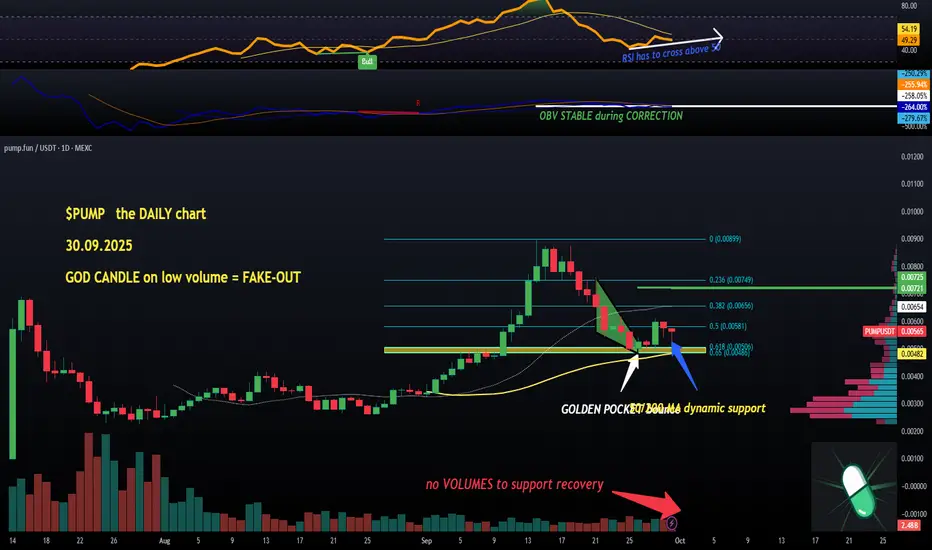
And it turned out to be a fake-out which trapped many bulls around 0.6c.
So now, looking at the heatmap (last month's bit) there is a lot of reasons to drop further and even as low as mid-3cents.
Or #pump it to 0.9c.
Time will tell and more details on shorter timeframes in terms of a possible reversal to the upside, but the DAILY is still missing rising volume candles but I am expecting this to change as soon as the 6c mark is established as support.
With volumes, again, as we need to see real buyers coming back in, the OBV is showing flat action during the recent correction which is a positive.
4-hour chart next.
💙👽
Wyłączenie odpowiedzialności
Informacje i publikacje przygotowane przez TradingView lub jego użytkowników, prezentowane na tej stronie, nie stanowią rekomendacji ani porad handlowych, inwestycyjnych i finansowych i nie powinny być w ten sposób traktowane ani wykorzystywane. Więcej informacji na ten temat znajdziesz w naszym Regulaminie.