Technical Analysis (TA) – Key Price Action Insights
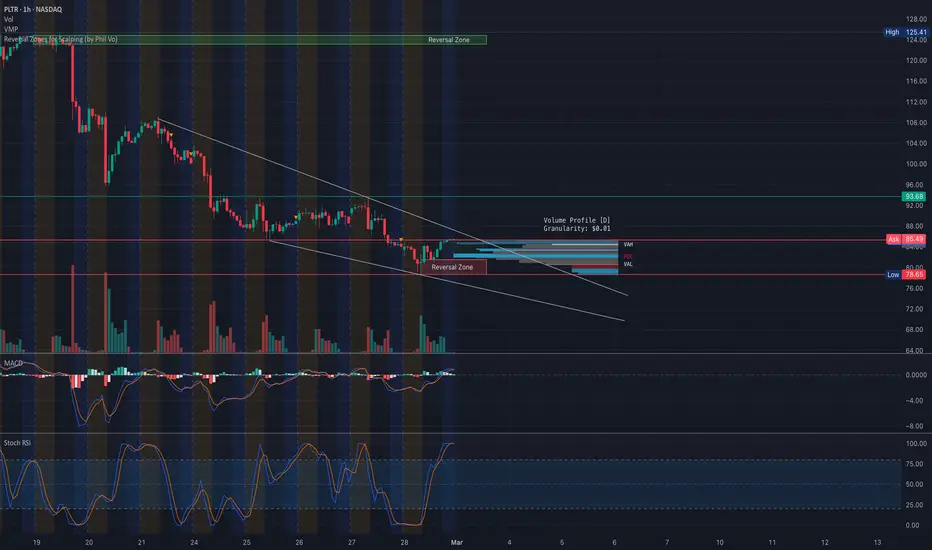
* Trend: PLTR has been in a clear downtrend, trading within a descending channel. A breakout above this structure could signal a reversal.
* Reversal Zone: The stock is testing a critical resistance zone around $85-$90, which aligns with the Volume Profile Point of Control (POC).
* Support Levels:
* $80: Key short-term support; failure to hold could send price towards $75-$72.
* $72: Strong historical support—a breakdown here could accelerate selling pressure.
* Resistance Levels:
* $90: First major upside level where a rejection is likely.
* $100-$105: Strong supply zone and potential breakout confirmation area.
Indicators:
* MACD: Recently crossed bullish, indicating possible momentum shift.
* Stochastic RSI: Overbought, suggesting a possible pullback before continuation.
GEX (Gamma Exposure) & Options Analysis

* Call Resistance:
* $90 (72.6% Wall): Heavy call positioning here could act as a major resistance.
* $100-$105: Next key call walls—if PLTR can clear these, a strong gamma squeeze could take it towards $120.
* Put Support:
* $80: Highest negative NetGEX level, which aligns with dealer positioning to support price.
* $75-$72: Strong put walls—if these break, expect dealers to hedge by selling stock, increasing downside pressure.
* IV & Sentiment:
* IV Rank (IVR): 71.4 – High implied volatility means options are expensive.
* Options Positioning: Calls 26.4% → Mixed sentiment, slightly bullish bias.
Trading Plan & Strategy
🔹 Bullish Scenario: If PLTR holds above $85 and breaks $90, it could trigger a gamma squeeze toward $100-$105. A daily close above $105 could lead to $120+ in the mid-term.
🔻 Bearish Scenario: Failure to hold $80 could trigger dealer hedging, leading to a breakdown toward $75-$72.
Final Thoughts & Suggestions
* Options Traders: Consider selling puts at $80 or a bull call spread if bullish. For bearish setups, a bear put spread targeting $75 makes sense.
* Equity Traders: Look for confirmation at $90 for a bullish entry or wait for a retest at $80-$75 for better risk-reward.
⚠️ This analysis is for educational purposes only and does not constitute financial advice. Always do your own research and manage risk accordingly. 🚀📉
* Trend: PLTR has been in a clear downtrend, trading within a descending channel. A breakout above this structure could signal a reversal.
* Reversal Zone: The stock is testing a critical resistance zone around $85-$90, which aligns with the Volume Profile Point of Control (POC).
* Support Levels:
* $80: Key short-term support; failure to hold could send price towards $75-$72.
* $72: Strong historical support—a breakdown here could accelerate selling pressure.
* Resistance Levels:
* $90: First major upside level where a rejection is likely.
* $100-$105: Strong supply zone and potential breakout confirmation area.
Indicators:
* MACD: Recently crossed bullish, indicating possible momentum shift.
* Stochastic RSI: Overbought, suggesting a possible pullback before continuation.
GEX (Gamma Exposure) & Options Analysis
* Call Resistance:
* $90 (72.6% Wall): Heavy call positioning here could act as a major resistance.
* $100-$105: Next key call walls—if PLTR can clear these, a strong gamma squeeze could take it towards $120.
* Put Support:
* $80: Highest negative NetGEX level, which aligns with dealer positioning to support price.
* $75-$72: Strong put walls—if these break, expect dealers to hedge by selling stock, increasing downside pressure.
* IV & Sentiment:
* IV Rank (IVR): 71.4 – High implied volatility means options are expensive.
* Options Positioning: Calls 26.4% → Mixed sentiment, slightly bullish bias.
Trading Plan & Strategy
🔹 Bullish Scenario: If PLTR holds above $85 and breaks $90, it could trigger a gamma squeeze toward $100-$105. A daily close above $105 could lead to $120+ in the mid-term.
🔻 Bearish Scenario: Failure to hold $80 could trigger dealer hedging, leading to a breakdown toward $75-$72.
Final Thoughts & Suggestions
* Options Traders: Consider selling puts at $80 or a bull call spread if bullish. For bearish setups, a bear put spread targeting $75 makes sense.
* Equity Traders: Look for confirmation at $90 for a bullish entry or wait for a retest at $80-$75 for better risk-reward.
⚠️ This analysis is for educational purposes only and does not constitute financial advice. Always do your own research and manage risk accordingly. 🚀📉
Wyłączenie odpowiedzialności
Informacje i publikacje przygotowane przez TradingView lub jego użytkowników, prezentowane na tej stronie, nie stanowią rekomendacji ani porad handlowych, inwestycyjnych i finansowych i nie powinny być w ten sposób traktowane ani wykorzystywane. Więcej informacji na ten temat znajdziesz w naszym Regulaminie.