Paras Defence Technical Analysis
🚀 Paras Defence & Space Technologies Ltd – Weekly Chart Analysis
The stock is showing signs of a potential reversal after consolidating near key support zones.
🔎 Technical Observations
Price Action:
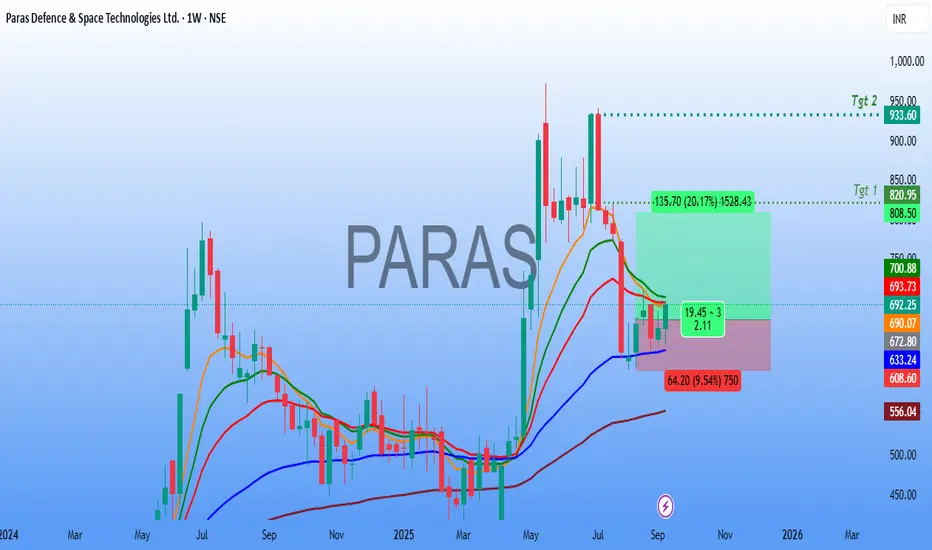
After a prolonged decline from the highs, the stock has stabilized around the ₹640–660 support region. The recent weekly candle indicates buying interest, with bulls defending key support levels.
Sustained strength above the ₹700 zone can accelerate momentum towards higher levels.
Risk–Reward Setup:
The chart shows a favorable long setup with a potential upside of 20–35%.
📌 Trading Plan
Entry Zone: ₹680 – ₹700
Stop-Loss: ₹640 (weekly close basis)
Target 1: ₹820 – ₹825
Target 2: ₹930 – ₹950
⚠️ Key Notes
The ₹640–650 zone is acting as a strong support; holding this level is crucial for the bullish setup.
A breakout above ₹700 with volume confirmation will strengthen the momentum towards Target 1.
📢 Conclusion
Paras Defence is forming a bullish setup on the weekly timeframe with a good risk-to-reward ratio. If the stock sustains above ₹700, a strong move towards ₹820 and later ₹930+ looks possible. Traders should keep a strict stop-loss at ₹640 to protect capital.
The stock is showing signs of a potential reversal after consolidating near key support zones.
🔎 Technical Observations
Price Action:
After a prolonged decline from the highs, the stock has stabilized around the ₹640–660 support region. The recent weekly candle indicates buying interest, with bulls defending key support levels.
Sustained strength above the ₹700 zone can accelerate momentum towards higher levels.
Risk–Reward Setup:
The chart shows a favorable long setup with a potential upside of 20–35%.
📌 Trading Plan
Entry Zone: ₹680 – ₹700
Stop-Loss: ₹640 (weekly close basis)
Target 1: ₹820 – ₹825
Target 2: ₹930 – ₹950
⚠️ Key Notes
The ₹640–650 zone is acting as a strong support; holding this level is crucial for the bullish setup.
A breakout above ₹700 with volume confirmation will strengthen the momentum towards Target 1.
📢 Conclusion
Paras Defence is forming a bullish setup on the weekly timeframe with a good risk-to-reward ratio. If the stock sustains above ₹700, a strong move towards ₹820 and later ₹930+ looks possible. Traders should keep a strict stop-loss at ₹640 to protect capital.
Zlecenie aktywne
Wyłączenie odpowiedzialności
Informacje i publikacje przygotowane przez TradingView lub jego użytkowników, prezentowane na tej stronie, nie stanowią rekomendacji ani porad handlowych, inwestycyjnych i finansowych i nie powinny być w ten sposób traktowane ani wykorzystywane. Więcej informacji na ten temat znajdziesz w naszym Regulaminie.