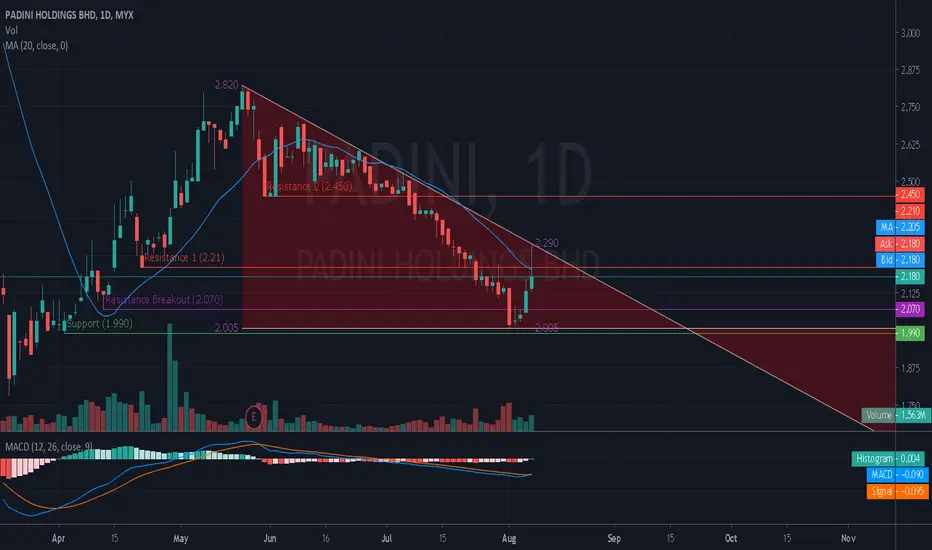
Technically, it is not looking good for PADINI as its 20-Day Moving Average is sloping downward and its price action is below the Moving Average line.
Furthermore the support level is still quite far at 2.01.
Descending Triangle identified at 3 Aug 20.
This pattern is still in the process of forming.
Possible bearish price movement towards the support within next 49 days (ETA 21 Sep 20)
Resistance 1 : 2.45
Resistance 2 : 2.21
Support : 1.990
Resistance Breakout : 2.070 (13 Apr 2020)
Zlecenie aktywne
Zlecenie aktywne
Wyłączenie odpowiedzialności
Informacje i publikacje przygotowane przez TradingView lub jego użytkowników, prezentowane na tej stronie, nie stanowią rekomendacji ani porad handlowych, inwestycyjnych i finansowych i nie powinny być w ten sposób traktowane ani wykorzystywane. Więcej informacji na ten temat znajdziesz w naszym Regulaminie.