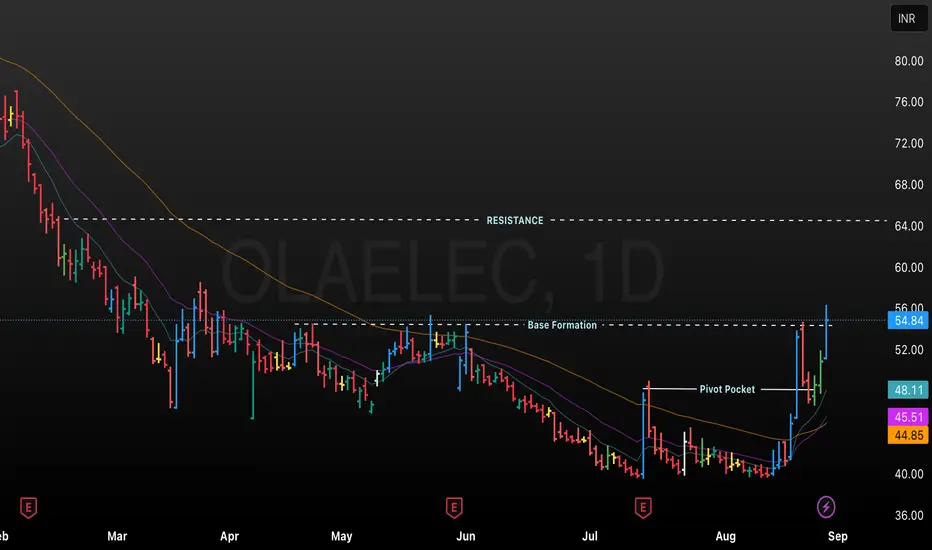
This chart displays the daily candlestick price action for OLA Electric, showing trends from February to August. Key technical levels are annotated, such as Resistance near 64, a Base Formation region, and a Pivot Pocket, indicating areas of price consolidation and breakout attempts. Moving averages (possibly 20-day, 50-day, and 200-day) are included, and the latest price is 54.84 INR, with a significant gain of +7.91% on the day. The chart is useful for analyzing support, resistance, and trend development in OLA Electric’s stock
Wyłączenie odpowiedzialności
Informacje i publikacje przygotowane przez TradingView lub jego użytkowników, prezentowane na tej stronie, nie stanowią rekomendacji ani porad handlowych, inwestycyjnych i finansowych i nie powinny być w ten sposób traktowane ani wykorzystywane. Więcej informacji na ten temat znajdziesz w naszym Regulaminie.