📊 Technical Analysis: OFSS – Weekly Chart
🌀 Elliott Wave Count
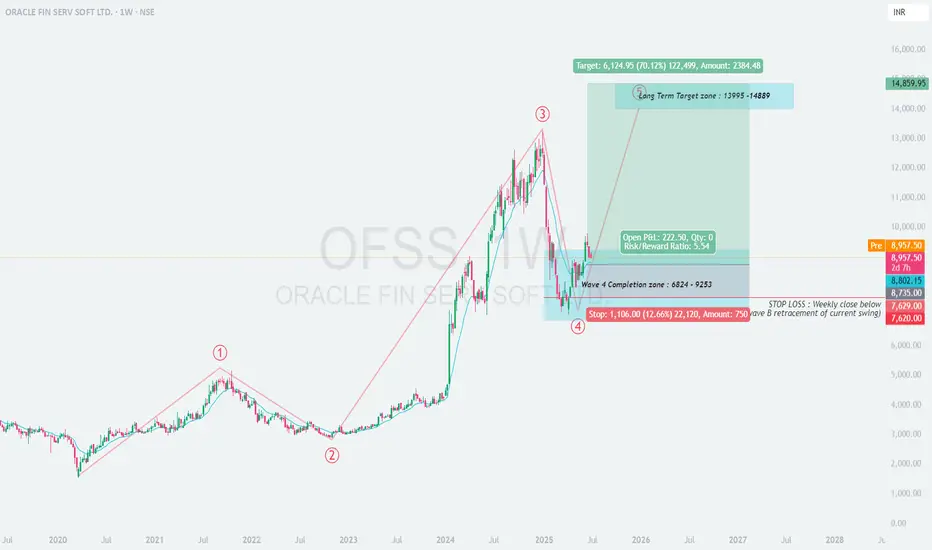
The chart shows a classic impulsive 5-wave Elliott structure.
Currently, Wave 4 seems to have completed in the zone of ₹6824–₹9253.
The current price action indicates the beginning of Wave 5, targeting significant upside.
🟦 Wave 4 Completion Zone: ₹6824–₹9253
Strong buying interest observed in this zone.
Multiple bullish candles from the support band indicate trend resumption.
Wave structure suggests upside momentum may now pick up.
🟩 Long-Term Target Zone: ₹13,995 – ₹14,889
Based on the projected Wave 5 extension, the upside potential is nearly +70% from current levels.
Ideal for long-term investors and positional traders.
📝 Trade Setup
✅ Entry:
Current Market Price (CMP) ~ ₹8,957
🎯 Targets:
T1: ₹13,995
T2: ₹14,889
❌ Stop Loss:
Weekly close below ₹7,629 (Wave B retracement & structure invalidation)
📈 Risk-Reward Ratio: ~5.54
🔒 Risk per share: ₹1,106
🚀 Potential Gain per share: ₹6,124
🧠 Trade Logic
Strong Elliott wave structure favors Wave 5 continuation.
Risk is well-defined and acceptable for the expected return.
Ideal case of “buying into the start of an impulsive wave”.
📌 Summary:
OFSS has completed its Wave 4 corrective phase and is now positioned for a strong Wave 5 rally. Long-term investors may consider accumulating near current levels for a target of ₹14,800+, maintaining a strict SL below ₹7,620 on a weekly close basis.
🌀 Elliott Wave Count
The chart shows a classic impulsive 5-wave Elliott structure.
Currently, Wave 4 seems to have completed in the zone of ₹6824–₹9253.
The current price action indicates the beginning of Wave 5, targeting significant upside.
🟦 Wave 4 Completion Zone: ₹6824–₹9253
Strong buying interest observed in this zone.
Multiple bullish candles from the support band indicate trend resumption.
Wave structure suggests upside momentum may now pick up.
🟩 Long-Term Target Zone: ₹13,995 – ₹14,889
Based on the projected Wave 5 extension, the upside potential is nearly +70% from current levels.
Ideal for long-term investors and positional traders.
📝 Trade Setup
✅ Entry:
Current Market Price (CMP) ~ ₹8,957
🎯 Targets:
T1: ₹13,995
T2: ₹14,889
❌ Stop Loss:
Weekly close below ₹7,629 (Wave B retracement & structure invalidation)
📈 Risk-Reward Ratio: ~5.54
🔒 Risk per share: ₹1,106
🚀 Potential Gain per share: ₹6,124
🧠 Trade Logic
Strong Elliott wave structure favors Wave 5 continuation.
Risk is well-defined and acceptable for the expected return.
Ideal case of “buying into the start of an impulsive wave”.
📌 Summary:
OFSS has completed its Wave 4 corrective phase and is now positioned for a strong Wave 5 rally. Long-term investors may consider accumulating near current levels for a target of ₹14,800+, maintaining a strict SL below ₹7,620 on a weekly close basis.
Wyłączenie odpowiedzialności
Informacje i publikacje nie stanowią i nie powinny być traktowane jako porady finansowe, inwestycyjne, tradingowe ani jakiekolwiek inne rekomendacje dostarczane lub zatwierdzone przez TradingView. Więcej informacji znajduje się w Warunkach użytkowania.
Wyłączenie odpowiedzialności
Informacje i publikacje nie stanowią i nie powinny być traktowane jako porady finansowe, inwestycyjne, tradingowe ani jakiekolwiek inne rekomendacje dostarczane lub zatwierdzone przez TradingView. Więcej informacji znajduje się w Warunkach użytkowania.