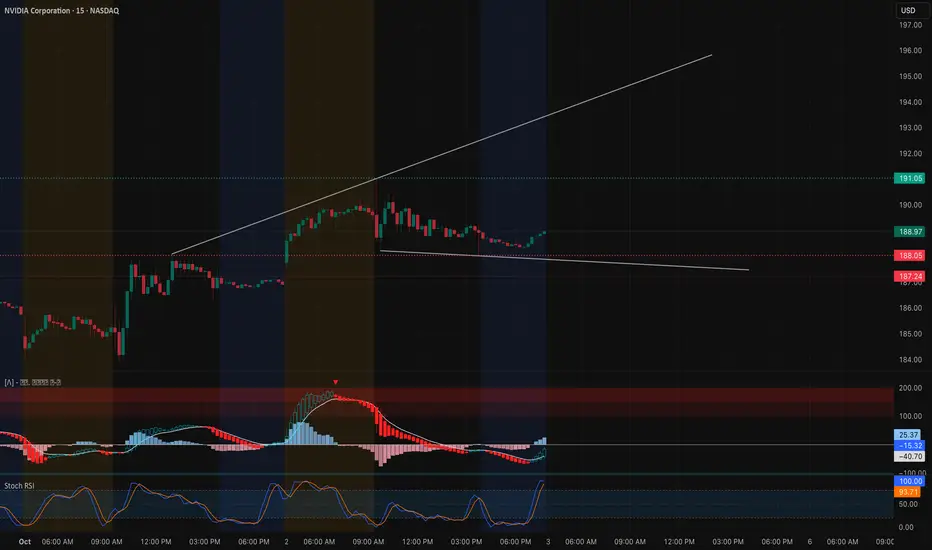
Intraday Technical Outlook (15m Chart)
NVIDIA (NVDA) closed near $188.97, stabilizing after an intraday fade from the $191 zone. On the 15-minute chart, price action shows consolidation with buyers trying to defend key support:
* MACD: Flattening and curling back toward neutral, signaling momentum could flip positive if buyers step in early tomorrow.
* Stoch RSI: Pushed back into overbought levels, showing near-term buying strength but also risk of quick pullbacks.
* Key Levels: Support rests at $188–187.2, with stronger downside protection near $185. Resistance is set at $191–192, the prior high and channel top.
Intraday takeaway: NVDA is range-bound between $187 and $191. A breakout above $191 can accelerate toward $193–195, while a failure to hold $187.2 risks a slide back toward $185.
Options Sentiment & GEX Outlook (1H Chart)

The 1-hour GEX setup highlights a tight battle around current levels:
* Gamma Walls:
* $191–192.5: Strongest positive GEX / call wall cluster — key resistance zone.
* $187.5–185: Gamma pivot and support levels where buyers may defend.
* $180 / $175: Put wall supports if selling pressure intensifies.
* Implications:
* Sustaining above $188.5–189 keeps NVDA magnetized toward the $191–192.5 call wall.
* If $187.2 fails, dealer flows may drive price toward $185 and potentially $180.
* Volatility Context: IVR sits at 10.1 (very low), meaning options are cheap relative to history. This makes directional call/put buys attractive — but also means sellers risk getting trapped if momentum surges.
My Thoughts & Recommendation
For Oct 3 trading, NVDA sits at a gamma pivot with a tight setup:
* Intraday (scalping/trading): Longs favored above $188.5, targeting $191–192.5. Quick rejection at $191 can be shorted back to $187.2–185.
* Options trading (swing/0DTE): Calls make sense only above $189–190 for a breakout chase toward $193–195. If NVDA fails at $191 and dips below $187.2, puts targeting $185–180 have cleaner risk/reward.
Bias heading into Oct 3: Neutral-to-bullish, but watch $191 as the breakout test.
Disclaimer: This analysis is for educational purposes only and does not constitute financial advice. Always do your own research and manage risk before trading.
NVIDIA (NVDA) closed near $188.97, stabilizing after an intraday fade from the $191 zone. On the 15-minute chart, price action shows consolidation with buyers trying to defend key support:
* MACD: Flattening and curling back toward neutral, signaling momentum could flip positive if buyers step in early tomorrow.
* Stoch RSI: Pushed back into overbought levels, showing near-term buying strength but also risk of quick pullbacks.
* Key Levels: Support rests at $188–187.2, with stronger downside protection near $185. Resistance is set at $191–192, the prior high and channel top.
Intraday takeaway: NVDA is range-bound between $187 and $191. A breakout above $191 can accelerate toward $193–195, while a failure to hold $187.2 risks a slide back toward $185.
Options Sentiment & GEX Outlook (1H Chart)
The 1-hour GEX setup highlights a tight battle around current levels:
* Gamma Walls:
* $191–192.5: Strongest positive GEX / call wall cluster — key resistance zone.
* $187.5–185: Gamma pivot and support levels where buyers may defend.
* $180 / $175: Put wall supports if selling pressure intensifies.
* Implications:
* Sustaining above $188.5–189 keeps NVDA magnetized toward the $191–192.5 call wall.
* If $187.2 fails, dealer flows may drive price toward $185 and potentially $180.
* Volatility Context: IVR sits at 10.1 (very low), meaning options are cheap relative to history. This makes directional call/put buys attractive — but also means sellers risk getting trapped if momentum surges.
My Thoughts & Recommendation
For Oct 3 trading, NVDA sits at a gamma pivot with a tight setup:
* Intraday (scalping/trading): Longs favored above $188.5, targeting $191–192.5. Quick rejection at $191 can be shorted back to $187.2–185.
* Options trading (swing/0DTE): Calls make sense only above $189–190 for a breakout chase toward $193–195. If NVDA fails at $191 and dips below $187.2, puts targeting $185–180 have cleaner risk/reward.
Bias heading into Oct 3: Neutral-to-bullish, but watch $191 as the breakout test.
Disclaimer: This analysis is for educational purposes only and does not constitute financial advice. Always do your own research and manage risk before trading.
Wyłączenie odpowiedzialności
Informacje i publikacje nie stanowią i nie powinny być traktowane jako porady finansowe, inwestycyjne, tradingowe ani jakiekolwiek inne rekomendacje dostarczane lub zatwierdzone przez TradingView. Więcej informacji znajduje się w Warunkach użytkowania.
Wyłączenie odpowiedzialności
Informacje i publikacje nie stanowią i nie powinny być traktowane jako porady finansowe, inwestycyjne, tradingowe ani jakiekolwiek inne rekomendacje dostarczane lub zatwierdzone przez TradingView. Więcej informacji znajduje się w Warunkach użytkowania.