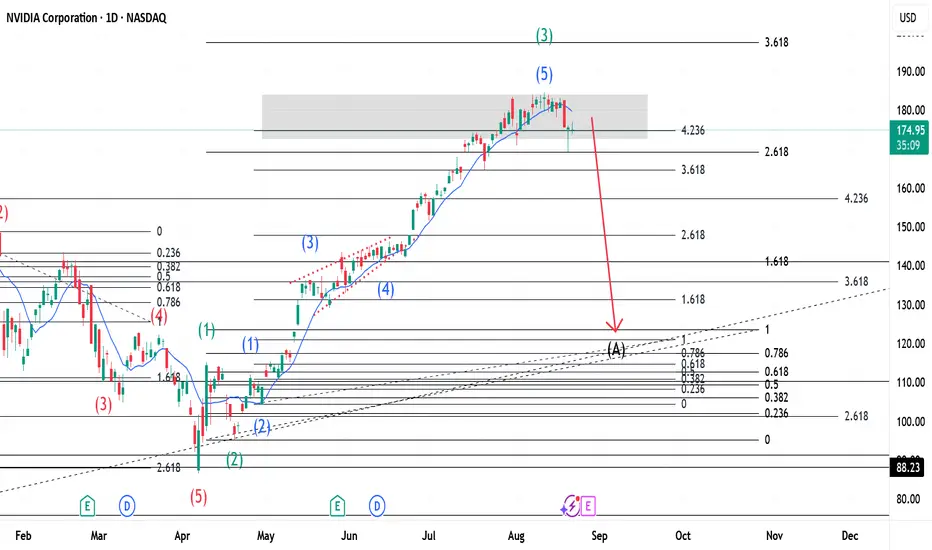
This is an update of a previous publication(link below). With price above the 423% Fib. level, this means that there is overbuying. Using Elliott Wave Theory we can see that Wave 3(Green) is complete with 5 waves(shown in Blue) inside it. What should follow from this is a Flat correction for Wave 4(Green) because Wave 2(Green) was a Zigzag. The Red arrow shows price direction only and points to a Wave A(Black) as our first wave for the Zigzag. This arrow does not show precise price ending rather shows direction. For more on the same, go to:

Wyłączenie odpowiedzialności
Informacje i publikacje przygotowane przez TradingView lub jego użytkowników, prezentowane na tej stronie, nie stanowią rekomendacji ani porad handlowych, inwestycyjnych i finansowych i nie powinny być w ten sposób traktowane ani wykorzystywane. Więcej informacji na ten temat znajdziesz w naszym Regulaminie.