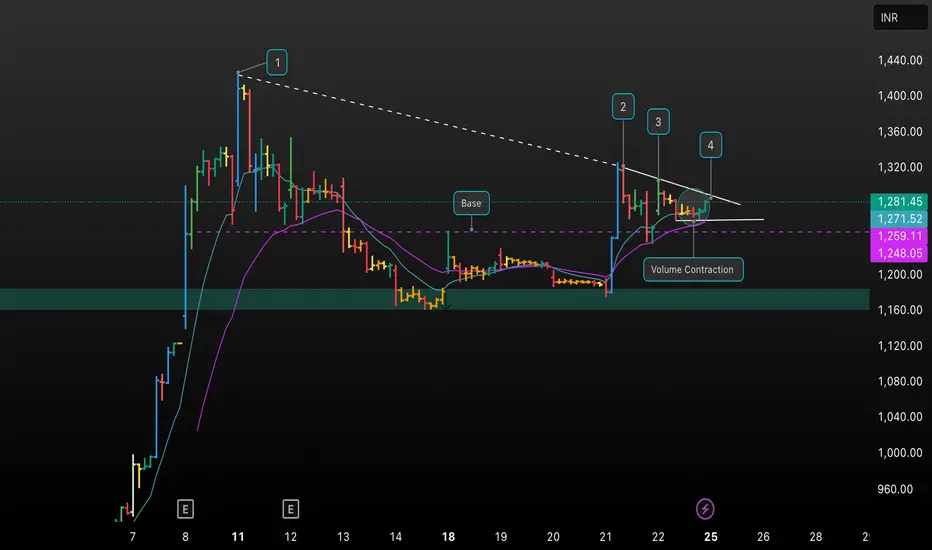
This chart showcases a detailed technical analysis of NSDL on the 45m timeframe, highlighting key price action zones, trendlines, and volume contraction patterns. I’ve marked the base formation, breakout attempts, and areas of interest using numbered points and indicator overlays. Notice the distinct volume contraction phase as price consolidates near resistance, potentially setting up a breakout. Key support/resistance levels and moving averages are also plotted.
Your feedback on this setup or alternative charting perspectives is welcome! Let’s discuss the probabilities and potential trade management for this breakout scenario.
This combination is clear, educational, and designed to invite discussion and engagement from traders and learners.
Your feedback on this setup or alternative charting perspectives is welcome! Let’s discuss the probabilities and potential trade management for this breakout scenario.
This combination is clear, educational, and designed to invite discussion and engagement from traders and learners.
Wyłączenie odpowiedzialności
Informacje i publikacje przygotowane przez TradingView lub jego użytkowników, prezentowane na tej stronie, nie stanowią rekomendacji ani porad handlowych, inwestycyjnych i finansowych i nie powinny być w ten sposób traktowane ani wykorzystywane. Więcej informacji na ten temat znajdziesz w naszym Regulaminie.