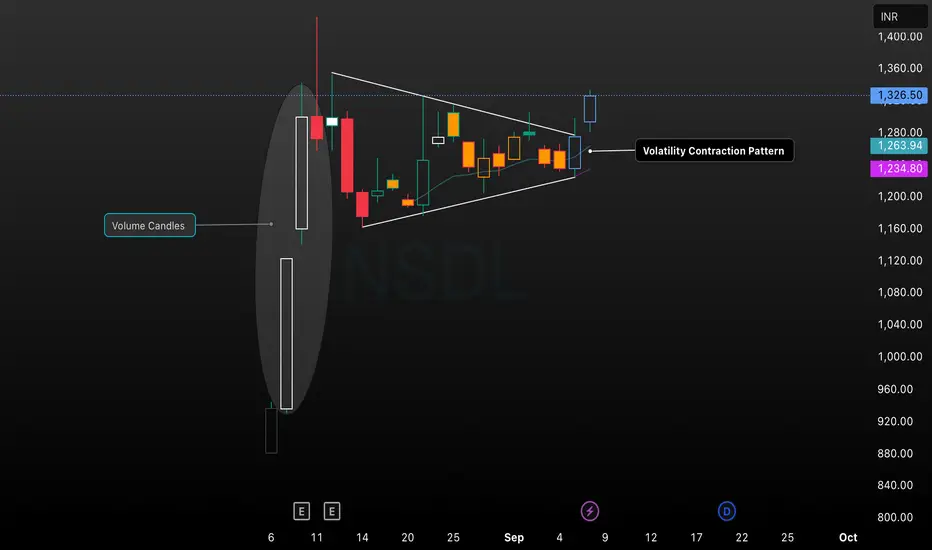
This chart displays the NSDL stock price on a daily timeframe, featuring a classic Volatility Contraction Pattern (VCP) after a surge in volume and price. The consolidation phase is marked by converging trendlines, with price contracting and forming tighter ranges. The recent breakout above the upper trendline signals renewed bullish momentum. Volume candles accentuate the initial surge, and key support/resistance levels are noted. This technical setup is ideal for traders seeking entries based on volatility contraction and breakout strategies.
Wyłączenie odpowiedzialności
Informacje i publikacje przygotowane przez TradingView lub jego użytkowników, prezentowane na tej stronie, nie stanowią rekomendacji ani porad handlowych, inwestycyjnych i finansowych i nie powinny być w ten sposób traktowane ani wykorzystywane. Więcej informacji na ten temat znajdziesz w naszym Regulaminie.