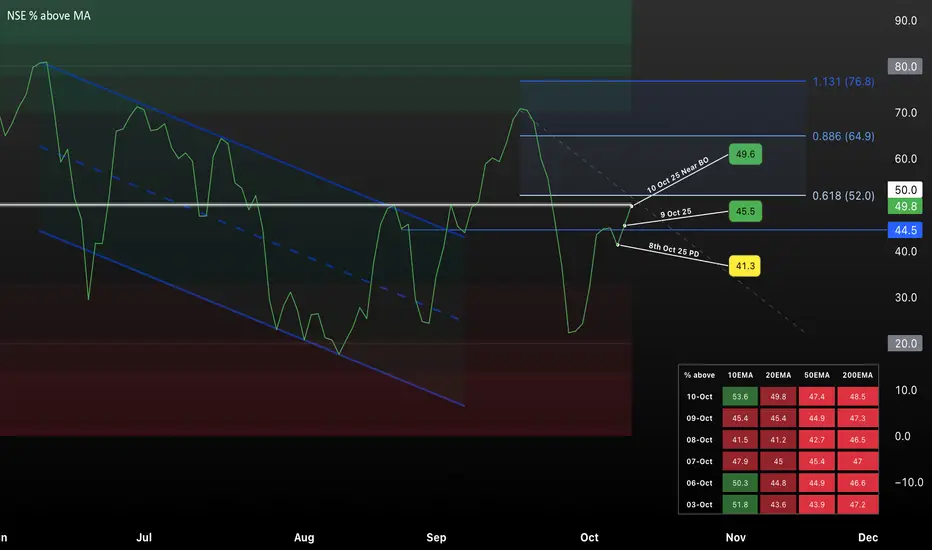
This TradingView chart visualizes the percentage of NSE stocks trading above key moving averages (10EMA, 20EMA, 50EMA, 200EMA) over recent months, highlighting a potential breakout zone as of October 2025. Key price levels (41.3, 44.5, 45.5, 49.6) are marked, with Fibonacci retracement zones indicating possible resistance and support. The chart showcases prior downtrend, recent recovery, and stalled momentum around the 50 level, making it a useful reference for market breadth and trend strength analysis for short-term trading strategies.
Wyłączenie odpowiedzialności
Informacje i publikacje nie stanowią i nie powinny być traktowane jako porady finansowe, inwestycyjne, tradingowe ani jakiekolwiek inne rekomendacje dostarczane lub zatwierdzone przez TradingView. Więcej informacji znajduje się w Warunkach użytkowania.
Wyłączenie odpowiedzialności
Informacje i publikacje nie stanowią i nie powinny być traktowane jako porady finansowe, inwestycyjne, tradingowe ani jakiekolwiek inne rekomendacje dostarczane lub zatwierdzone przez TradingView. Więcej informacji znajduje się w Warunkach użytkowania.