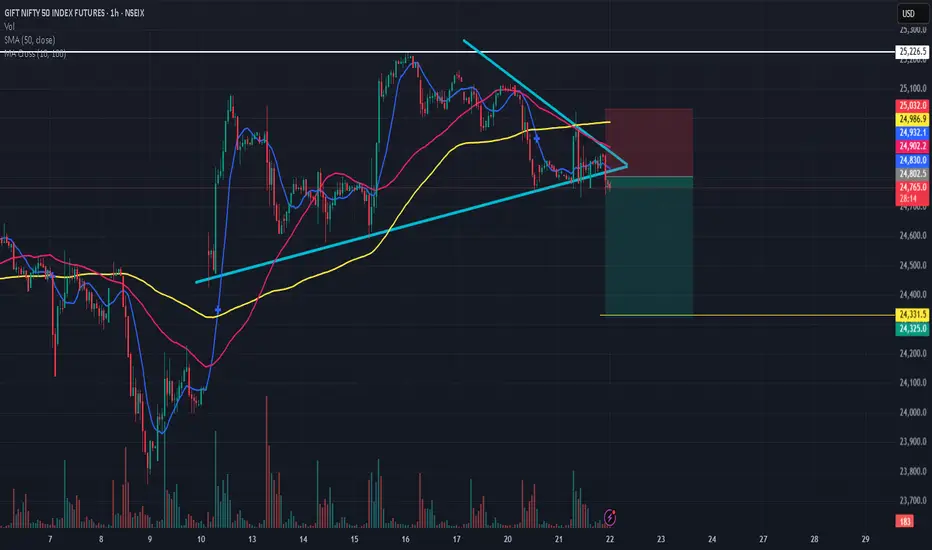
A triangle chart pattern is a tool used in technical analysis. Named for its resemblance to a series of triangles, the triangle chart pattern is created by drawing trendlines along a converging price range. The result signals a pause in the prevailing trend.
Technical analysts read the triangle as an indicator of a continuation of an existing trend or reversal.
Despite being a continuation, traders should look for breakouts before they make a move to buy or sell.
Technical analysts read the triangle as an indicator of a continuation of an existing trend or reversal.
Despite being a continuation, traders should look for breakouts before they make a move to buy or sell.
Wyłączenie odpowiedzialności
Informacje i publikacje przygotowane przez TradingView lub jego użytkowników, prezentowane na tej stronie, nie stanowią rekomendacji ani porad handlowych, inwestycyjnych i finansowych i nie powinny być w ten sposób traktowane ani wykorzystywane. Więcej informacji na ten temat znajdziesz w naszym Regulaminie.