🔎 4H Chart (Swing Bias)
Strong downtrend from 25,200 → series of lower highs & lower lows.
Price reclaimed from 24,400 demand zone and is now retesting FVG around 24,600–24,650.
Overhead supply at 24,800–25,000 remains untested → still bearish higher-timeframe bias unless broken.
Momentum: Relief rally inside downtrend channel.
Bias: Short-term pullback possible, but broader trend still bearish.
⏱ 1H Chart (Intraday Bias)
Clear channel breakout on upside; price now consolidating above 24,600.
First FVG (24,600–24,650) being tested; possible extension toward 24,750–24,800 resistance.
Volume imbalance + liquidity sweep visible near 24,550 → confirms buyers stepping in.
EMA slope still downward, so rally = corrective, not reversal yet.
Bias: Bullish intraday until 24,750–24,800 supply zone.
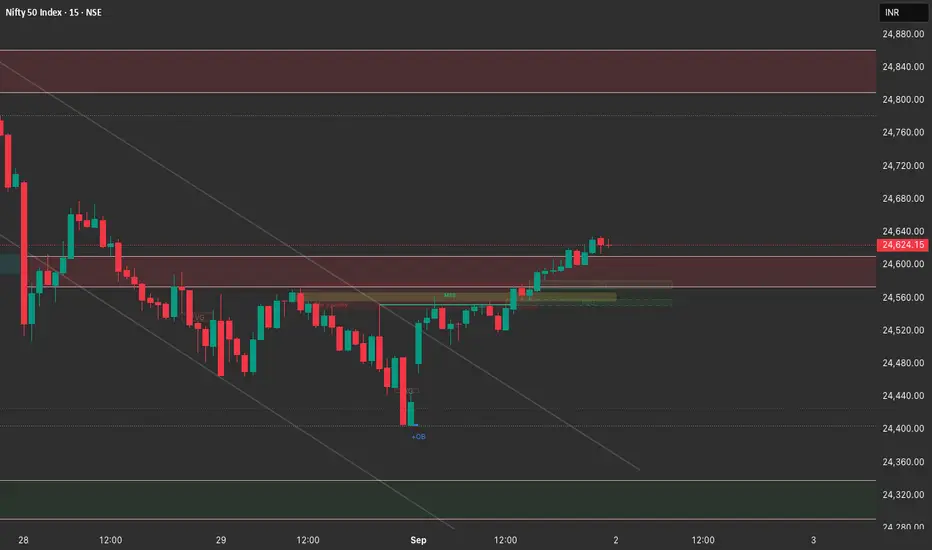
🕒 15M Chart (Execution Lens)
Price showing BOS (Break of Structure) → minor bullish structure shift.
Liquidity grab below 24,500, followed by impulsive rally = signs of accumulation.
Immediate intraday OB/FVG support at 24,550–24,580.
Resistance supply zone: 24,700–24,750 (first test).
Bias: Intraday longs until 24,700–24,750. Beyond that, cautious.
📑 Trade Plan for 2nd September
✅ Long Setup
Entry Zone: 24,550–24,580 (pullback into OB/FVG).
Target 1: 24,700
Target 2: 24,750–24,800
Stop Loss: Below 24,480 (swing low).
Risk–Reward: ~1:2
❌ Short Setup (if rejection seen)
Entry Zone: 24,750–24,800 (supply/FVG).
Target 1: 24,600
Target 2: 24,450
Stop Loss: Above 24,850
Risk–Reward: ~1:2
📌 Summary:
For 2nd Sept, Nifty is in a corrective bullish move inside a bearish trend. Best approach is to buy dips till 24,750–24,800, then watch for rejection signs to flip short.
Strong downtrend from 25,200 → series of lower highs & lower lows.
Price reclaimed from 24,400 demand zone and is now retesting FVG around 24,600–24,650.
Overhead supply at 24,800–25,000 remains untested → still bearish higher-timeframe bias unless broken.
Momentum: Relief rally inside downtrend channel.
Bias: Short-term pullback possible, but broader trend still bearish.
⏱ 1H Chart (Intraday Bias)
Clear channel breakout on upside; price now consolidating above 24,600.
First FVG (24,600–24,650) being tested; possible extension toward 24,750–24,800 resistance.
Volume imbalance + liquidity sweep visible near 24,550 → confirms buyers stepping in.
EMA slope still downward, so rally = corrective, not reversal yet.
Bias: Bullish intraday until 24,750–24,800 supply zone.
🕒 15M Chart (Execution Lens)
Price showing BOS (Break of Structure) → minor bullish structure shift.
Liquidity grab below 24,500, followed by impulsive rally = signs of accumulation.
Immediate intraday OB/FVG support at 24,550–24,580.
Resistance supply zone: 24,700–24,750 (first test).
Bias: Intraday longs until 24,700–24,750. Beyond that, cautious.
📑 Trade Plan for 2nd September
✅ Long Setup
Entry Zone: 24,550–24,580 (pullback into OB/FVG).
Target 1: 24,700
Target 2: 24,750–24,800
Stop Loss: Below 24,480 (swing low).
Risk–Reward: ~1:2
❌ Short Setup (if rejection seen)
Entry Zone: 24,750–24,800 (supply/FVG).
Target 1: 24,600
Target 2: 24,450
Stop Loss: Above 24,850
Risk–Reward: ~1:2
📌 Summary:
For 2nd Sept, Nifty is in a corrective bullish move inside a bearish trend. Best approach is to buy dips till 24,750–24,800, then watch for rejection signs to flip short.
Wyłączenie odpowiedzialności
Informacje i publikacje nie stanowią i nie powinny być traktowane jako porady finansowe, inwestycyjne, tradingowe ani jakiekolwiek inne rekomendacje dostarczane lub zatwierdzone przez TradingView. Więcej informacji znajduje się w Warunkach użytkowania.
Wyłączenie odpowiedzialności
Informacje i publikacje nie stanowią i nie powinny być traktowane jako porady finansowe, inwestycyjne, tradingowe ani jakiekolwiek inne rekomendacje dostarczane lub zatwierdzone przez TradingView. Więcej informacji znajduje się w Warunkach użytkowania.