📌 NIFTY Weekly Chart – Double Bottom Breakout Analysis
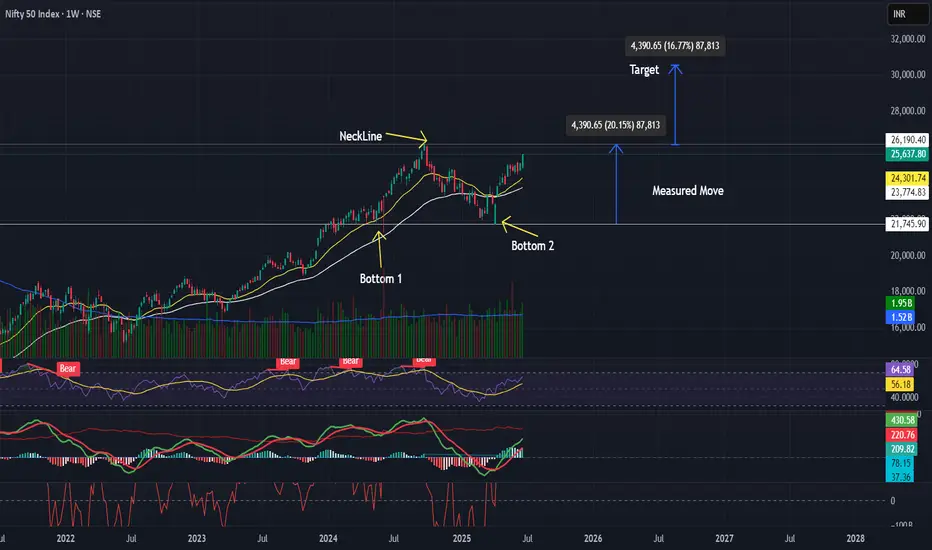
After a long corrective phase, NIFTY is forming a classic Double Bottom pattern on the weekly timeframe. This is typically a bullish reversal signal.
✅ Pattern: Double Bottom on Weekly Chart
✅ Bottom Levels: ~21,800
✅ Neckline Resistance: ~26,200
📈 Breakout Strategy:
Watch for a weekly close above 26,200 with higher volume to confirm breakout strength.
✅ Measured Move Target: ~30,600
Calculation: Neckline + (Neckline – Bottom) ≈ 26,200 + (4,400)
✅ Stop-loss Options:
ATR-based stop: ~25,530
Chart-based conservative stop: ~24,500
🔎 Bias: Bullish above 26,200 with confirmed weekly close and volume expansion.
📌 Volume Note: Look for rising volume near the neckline to validate the breakout.
This setup aligns with strong macro drivers such as India’s economic resilience and sector rotation into large caps.
Wyłączenie odpowiedzialności
Informacje i publikacje przygotowane przez TradingView lub jego użytkowników, prezentowane na tej stronie, nie stanowią rekomendacji ani porad handlowych, inwestycyjnych i finansowych i nie powinny być w ten sposób traktowane ani wykorzystywane. Więcej informacji na ten temat znajdziesz w naszym Regulaminie.