📘 NIFTY TRADING PLAN – 22-Apr-2025
📊 Index Spot Close: 24,121.20 | ⏱ Timeframe: 15-Min | 🚪 Gap Opening Threshold: 100+ Points
🔼 Scenario 1: Gap-Up Opening (Above 24,221+)
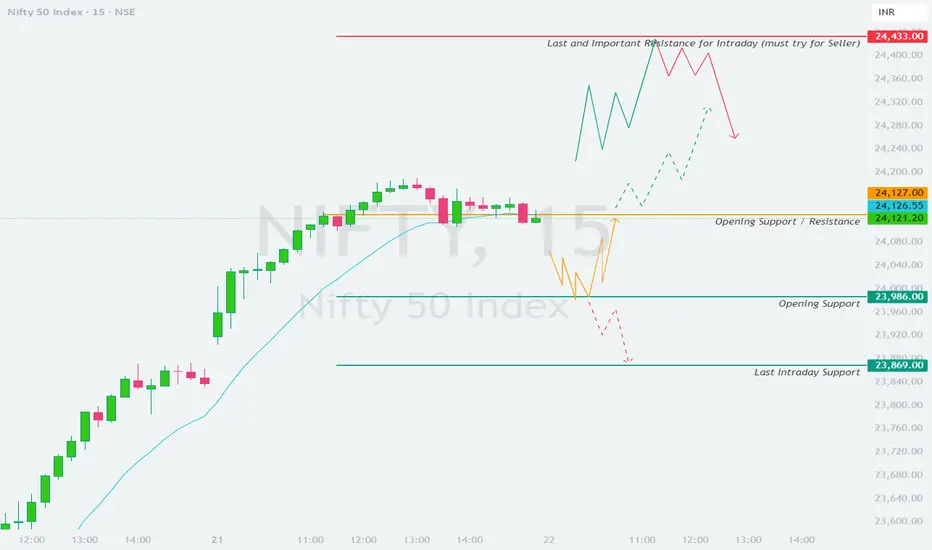
A gap-up opening above 24,221 will push Nifty into a zone where sellers will likely get active. The chart highlights 24,433 as a "must try for sellers" level — this acts as the last important intraday resistance. Sustained movement beyond this level would be a bullish breakout, but chances of intraday reversal increase as price nears this resistance.
📌 Plan of Action:
💡 Educational Insight:
Gap-ups near major resistances are tricky — markets often use such openings for distribution. Watch price behavior at key levels instead of assuming breakout or reversal in advance.
⚖️ Scenario 2: Flat Opening (Between 24,020 – 24,221)
A flat opening within this range keeps Nifty in the current supply zone. The chart shows that 24,127 acts as a critical structure – previously both as resistance and a congestion area.
📌 Plan of Action:
💡 Educational Insight:
Flat openings near previous congestion levels often offer clean breakouts or breakdowns. Let the price action confirm direction – patience pays in such setups.
🔽 Scenario 3: Gap-Down Opening (Below 24,020–23,986)
A gap-down below the 23,986 support area would indicate potential profit booking or intraday reversal. The key support to monitor is 23,869 – labeled as "last intraday support" on your chart.
📌 Plan of Action:
💡 Educational Insight:
Gap-downs into key support zones often trap emotional sellers. Let price confirm breakdown — don’t assume it. Wait for candle confirmation before acting.
🛡️ Risk Management Tips for Options Traders 💼🧠
✅ Don’t trade first 15–30 minutes — let the market show intent.
✅ Use ITM or ATM options for better delta and less time decay.
✅ Position sizing is key — don’t risk more than 1–2% of capital on one trade.
✅ Avoid revenge trading — step back after a loss and reassess.
✅ Avoid averaging losers — have a clear SL and respect it.
✅ Don’t chase moves — especially after gaps; wait for retests.
✅ Maintain a trading journal — log entry/exit and reason behind trade.
✅ In volatile markets, hedge directional bets with spreads if needed.
🧾 Summary & Conclusion 🧠📊
📍 Gap-Up (Above 24,221): Sellers may get active near 24,433; watch for reversal signs.
📍 Flat Open (24,020–24,221): Critical level is 24,127 — breakout leads to 24,280, rejection leads to 23,986.
📍 Gap-Down (Below 24,020): Breakdown below 23,869 can trigger further fall; else, watch for bounce attempts.
📍 Zone to Monitor Closely: 24,127 and 23,986 — act as pivotal levels for intraday structure.
🧘♂️ Final Note: Trade levels, not emotions. Capital protection is the first job of a trader. Stick to your process and trust your risk management — opportunities will come.
⚠️ Disclaimer:
I am not a SEBI-registered analyst. This trading plan is prepared purely for educational purposes only. Kindly consult with your financial advisor before making any investment or trading decisions. Markets involve risk — please use strict stop-loss and position sizing.
📊 Index Spot Close: 24,121.20 | ⏱ Timeframe: 15-Min | 🚪 Gap Opening Threshold: 100+ Points
🔼 Scenario 1: Gap-Up Opening (Above 24,221+)
A gap-up opening above 24,221 will push Nifty into a zone where sellers will likely get active. The chart highlights 24,433 as a "must try for sellers" level — this acts as the last important intraday resistance. Sustained movement beyond this level would be a bullish breakout, but chances of intraday reversal increase as price nears this resistance.
📌 Plan of Action:
- [] Wait for the first 15–30 minutes to settle the gap-up volatility. Don't chase the first green candle.
[] If price sustains above 24,221 and starts climbing toward 24,433, watch for a rejection wick or bearish engulfing candle near that level to plan shorts.
[] Ideal short opportunity arises if price touches 24,433 and then shows weakness — keep SL just above 24,460, target could be 24,280 → 24,127.
[] If price consolidates above 24,433 without signs of exhaustion, consider it a bullish continuation setup. In that case, adopt a breakout-retest strategy with SL below 24,400. - Aggressive buyers can look for retest around 24,221–24,280 zone for a possible long setup toward uncharted zones.
💡 Educational Insight:
Gap-ups near major resistances are tricky — markets often use such openings for distribution. Watch price behavior at key levels instead of assuming breakout or reversal in advance.
⚖️ Scenario 2: Flat Opening (Between 24,020 – 24,221)
A flat opening within this range keeps Nifty in the current supply zone. The chart shows that 24,127 acts as a critical structure – previously both as resistance and a congestion area.
📌 Plan of Action:
- [] Let the market settle. If price holds above 24,127 for 15–30 minutes, intraday strength may follow toward 24,221 → 24,280.
[] Longs can be initiated above 24,150 with tight SL below 24,120 and targets near 24,221.
[] On the flip side, if Nifty starts rejecting 24,127, consider intraday shorts with SL above 24,150. Target on downside could be 24,000 → 23,986.
[] Be cautious about trading within a choppy range of 24,050–24,127 – breakout or breakdown from this area will provide cleaner moves. - Wait for directional confirmation through volume and momentum indicators like RSI or VWAP reaction.
💡 Educational Insight:
Flat openings near previous congestion levels often offer clean breakouts or breakdowns. Let the price action confirm direction – patience pays in such setups.
🔽 Scenario 3: Gap-Down Opening (Below 24,020–23,986)
A gap-down below the 23,986 support area would indicate potential profit booking or intraday reversal. The key support to monitor is 23,869 – labeled as "last intraday support" on your chart.
📌 Plan of Action:
- [] Do not enter trades immediately on the gap-down. Let the price show its intent in the first 15–30 mins.
[] If price sustains below 23,986 and breaks 23,869, intraday weakness can accelerate with downside targets at 23,800 → 23,720.
[] Intraday shorts can be initiated on breakdowns below 23,869 with SL above 23,900.
[] If price bounces back and reclaims 23,986, avoid fresh shorts — this could be a trap for sellers. - Aggressive reversal traders can look for bullish price action near 23,869 — a hammer or bullish engulfing candle with volume might offer a low-risk bounce trade toward 24,000.
💡 Educational Insight:
Gap-downs into key support zones often trap emotional sellers. Let price confirm breakdown — don’t assume it. Wait for candle confirmation before acting.
🛡️ Risk Management Tips for Options Traders 💼🧠
✅ Don’t trade first 15–30 minutes — let the market show intent.
✅ Use ITM or ATM options for better delta and less time decay.
✅ Position sizing is key — don’t risk more than 1–2% of capital on one trade.
✅ Avoid revenge trading — step back after a loss and reassess.
✅ Avoid averaging losers — have a clear SL and respect it.
✅ Don’t chase moves — especially after gaps; wait for retests.
✅ Maintain a trading journal — log entry/exit and reason behind trade.
✅ In volatile markets, hedge directional bets with spreads if needed.
🧾 Summary & Conclusion 🧠📊
📍 Gap-Up (Above 24,221): Sellers may get active near 24,433; watch for reversal signs.
📍 Flat Open (24,020–24,221): Critical level is 24,127 — breakout leads to 24,280, rejection leads to 23,986.
📍 Gap-Down (Below 24,020): Breakdown below 23,869 can trigger further fall; else, watch for bounce attempts.
📍 Zone to Monitor Closely: 24,127 and 23,986 — act as pivotal levels for intraday structure.
🧘♂️ Final Note: Trade levels, not emotions. Capital protection is the first job of a trader. Stick to your process and trust your risk management — opportunities will come.
⚠️ Disclaimer:
I am not a SEBI-registered analyst. This trading plan is prepared purely for educational purposes only. Kindly consult with your financial advisor before making any investment or trading decisions. Markets involve risk — please use strict stop-loss and position sizing.
Wyłączenie odpowiedzialności
Informacje i publikacje nie stanowią i nie powinny być traktowane jako porady finansowe, inwestycyjne, tradingowe ani jakiekolwiek inne rekomendacje dostarczane lub zatwierdzone przez TradingView. Więcej informacji znajduje się w Warunkach użytkowania.
Wyłączenie odpowiedzialności
Informacje i publikacje nie stanowią i nie powinny być traktowane jako porady finansowe, inwestycyjne, tradingowe ani jakiekolwiek inne rekomendacje dostarczane lub zatwierdzone przez TradingView. Więcej informacji znajduje się w Warunkach użytkowania.