📊 NIFTY TRADING PLAN — 20 NOV 2025
(Reference: 15-min chart structure & key intraday levels)
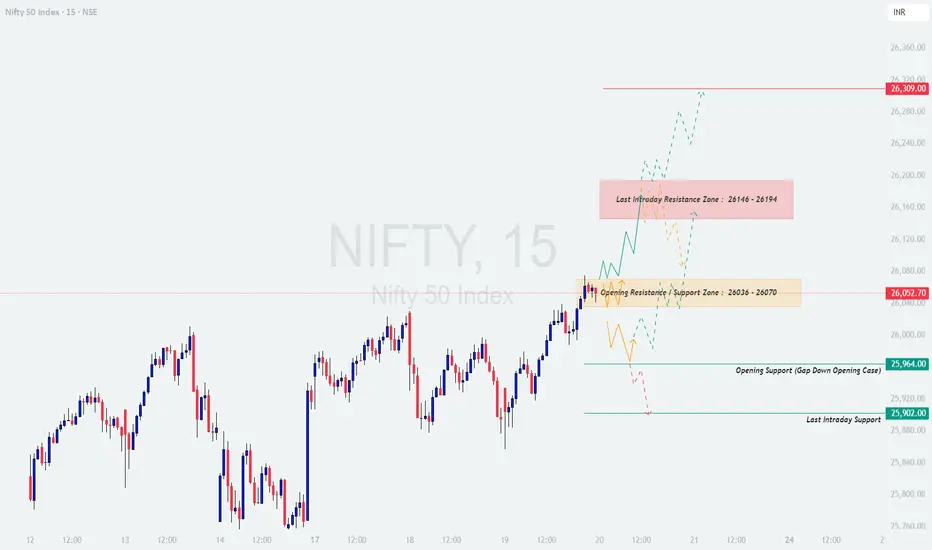
Nifty closed around 26,052, sitting just above the Opening Resistance / Support Zone (26,036 – 26,070). Price action is now heading toward a crucial supply area above 26,140–26,194, and short-term structure suggests volatility around the opening price.
Here are the major actionable levels for 20 Nov 2025:
🟧 Opening Resistance / Support Zone: 26,036 – 26,070
🟥 Last Intraday Resistance Zone: 26,146 – 26,194
🟥 Major Resistance: 26,309
🟩 Opening Support (Gap-down case): 25,964
🟩 Last Intraday Support: 25,902
Below is the complete plan for all opening scenarios 👇
🟢 SCENARIO 1 — GAP-UP OPENING (100+ Points)
If Nifty opens around 26,150–26,200, this places price directly inside or just under the Last Intraday Resistance Zone (26,146–26,194).
📘 Educational Note:
Gap-ups work best only when price makes higher lows after the open. A flat or weak first candle at resistance often signals exhaustion.
🟧 SCENARIO 2 — FLAT OPENING (Near 26,020–26,070)
A flat open places Nifty inside the Opening Resistance / Support Zone (26,036–26,070) — a decision region.
💡 Educational tip:
Flat openings are ideal for trend identification. The first 15-min candle usually gives strong directional clues — don’t rush in.
🔻 SCENARIO 3 — GAP-DOWN OPENING (100+ Points)
A gap-down below 25,970 puts price directly into the Opening Support zone (25,964).
📘 Educational Note:
Gap-downs into support often give the strongest reversal trades of the day — but only after confirmation.
💼 RISK MANAGEMENT TIPS FOR OPTION TRADERS 💡
⚠️ Golden Rule:
Your objective is to survive long enough to catch the big moves — protect your capital first.
📌 SUMMARY
Bullish above → 26,070
Target zone → 26,110 → 26,146 → 26,194 → 26,309
Bearish below → 25,964
Target zone → 25,902 → 25,860 → 25,820
Key No-Trade Areas:
— 26,036–26,070 (Flat opening zone)
— 26,150–26,194 (High-risk supply zone)
🧾 CONCLUSION
Nifty is trading near a heavy resistance cluster, and the market’s reaction to the 26,070 level will define the day’s trend.
The cleanest and safest trades will come from:
✔️ Breakout & retest above 26,070
✔️ Reversal from 25,964
✔️ Momentum breakout above 26,194
Avoid trading inside choppy zones and let the market reveal its direction.
⚠️ DISCLAIMER
I am not a SEBI-registered analyst. This analysis is for educational purposes only. Please consult a certified financial advisor before making any trading or investment decisions.
(Reference: 15-min chart structure & key intraday levels)
Nifty closed around 26,052, sitting just above the Opening Resistance / Support Zone (26,036 – 26,070). Price action is now heading toward a crucial supply area above 26,140–26,194, and short-term structure suggests volatility around the opening price.
Here are the major actionable levels for 20 Nov 2025:
🟧 Opening Resistance / Support Zone: 26,036 – 26,070
🟥 Last Intraday Resistance Zone: 26,146 – 26,194
🟥 Major Resistance: 26,309
🟩 Opening Support (Gap-down case): 25,964
🟩 Last Intraday Support: 25,902
Below is the complete plan for all opening scenarios 👇
🟢 SCENARIO 1 — GAP-UP OPENING (100+ Points)
If Nifty opens around 26,150–26,200, this places price directly inside or just under the Last Intraday Resistance Zone (26,146–26,194).
- []If price sustains above 26,194 for 10–20 minutes with strong volume →
⭐ Upside targets → 26,245 → 26,280 → 26,309
[]If price rejects 26,146–26,194, expect a correction toward:
➡️ 26,100 → 26,070
[]A bullish retest at 26,070 with reversal candles offers a safe long entry.
[]Avoid buying immediately at open — gap-ups near resistance often trap traders.
📘 Educational Note:
Gap-ups work best only when price makes higher lows after the open. A flat or weak first candle at resistance often signals exhaustion.
🟧 SCENARIO 2 — FLAT OPENING (Near 26,020–26,070)
A flat open places Nifty inside the Opening Resistance / Support Zone (26,036–26,070) — a decision region.
- []A clean breakout above 26,070 →
Targets → 26,110 → 26,146 → 26,194
[]If price breaks below 26,036, expect a drop to:
➡️ 25,964 (Opening Support)
[]Avoid trading inside the 26,030–26,070 zone until direction is clear.
[]Best trades will be:
— Breakout → Retest → Continuation
— Support bounce from 25,964
💡 Educational tip:
Flat openings are ideal for trend identification. The first 15-min candle usually gives strong directional clues — don’t rush in.
🔻 SCENARIO 3 — GAP-DOWN OPENING (100+ Points)
A gap-down below 25,970 puts price directly into the Opening Support zone (25,964).
- []If 25,964 holds with bullish wick rejection →
Upside targets → 26,020 → 26,070 → 26,110
[]If price breaks 25,964 decisively, next support zone:
➡️ 25,902 (Last Intraday Support)
[]A strong bounce from 25,902 can provide an excellent low-risk long entry.
[]If 25,902 breaks with momentum, downside expands to:
➡️ 25,860 → 25,820
📘 Educational Note:
Gap-downs into support often give the strongest reversal trades of the day — but only after confirmation.
💼 RISK MANAGEMENT TIPS FOR OPTION TRADERS 💡
- []Avoid trading the first 5–10 minutes after market opens.
[]Use ATM or ITM options for directional trades.
[]Define your stop loss BEFORE entering — never adjust it emotionally.
[]Avoid averaging in losing positions.
[]When VIX is low → option buying works better.
[]When VIX is high → prefer hedged option selling strategies. - Book partial profits — don’t wait for full target if momentum weakens.
⚠️ Golden Rule:
Your objective is to survive long enough to catch the big moves — protect your capital first.
📌 SUMMARY
Bullish above → 26,070
Target zone → 26,110 → 26,146 → 26,194 → 26,309
Bearish below → 25,964
Target zone → 25,902 → 25,860 → 25,820
Key No-Trade Areas:
— 26,036–26,070 (Flat opening zone)
— 26,150–26,194 (High-risk supply zone)
🧾 CONCLUSION
Nifty is trading near a heavy resistance cluster, and the market’s reaction to the 26,070 level will define the day’s trend.
The cleanest and safest trades will come from:
✔️ Breakout & retest above 26,070
✔️ Reversal from 25,964
✔️ Momentum breakout above 26,194
Avoid trading inside choppy zones and let the market reveal its direction.
⚠️ DISCLAIMER
I am not a SEBI-registered analyst. This analysis is for educational purposes only. Please consult a certified financial advisor before making any trading or investment decisions.
Transakcja zamknięta: osiągnięto wyznaczony cel
Charts don’t lie — and neither do my levels. Accuracy delivered.Wyłączenie odpowiedzialności
Informacje i publikacje nie stanowią i nie powinny być traktowane jako porady finansowe, inwestycyjne, tradingowe ani jakiekolwiek inne rekomendacje dostarczane lub zatwierdzone przez TradingView. Więcej informacji znajduje się w Warunkach użytkowania.
Wyłączenie odpowiedzialności
Informacje i publikacje nie stanowią i nie powinny być traktowane jako porady finansowe, inwestycyjne, tradingowe ani jakiekolwiek inne rekomendacje dostarczane lub zatwierdzone przez TradingView. Więcej informacji znajduje się w Warunkach użytkowania.